Due to the COVID-19 school closures in 2019-20, pass rates were not calculated because many assessments were not conducted. Listed below is the equity scorecard assessment data from 2017-18, 2018-19, and 2020-21
The data show on this page include the performance of Prince William County Public Schools (PWCS) students on Virginia Standards of Learning (SOL) tests for the previous three years. Performance is shown in each subject area tested (Reading, Mathematics, Science, History, and Writing). Within each subject area, there are charts for overall pass rates (by ethnicity and by student group) as well as for pass advanced rates.
The charts comparing student group performance show data and gaps over time between some or all of the identified student groups and their comparison groups. In many cases, multiple comparisons are shown on the same chart to conserve space. NOTE: The yellow outlined box that appears on some of the comparison charts is a visual representation of the gap between the groups being compared.
Reading
Reading SOL Pass Percentages by Ethnicity
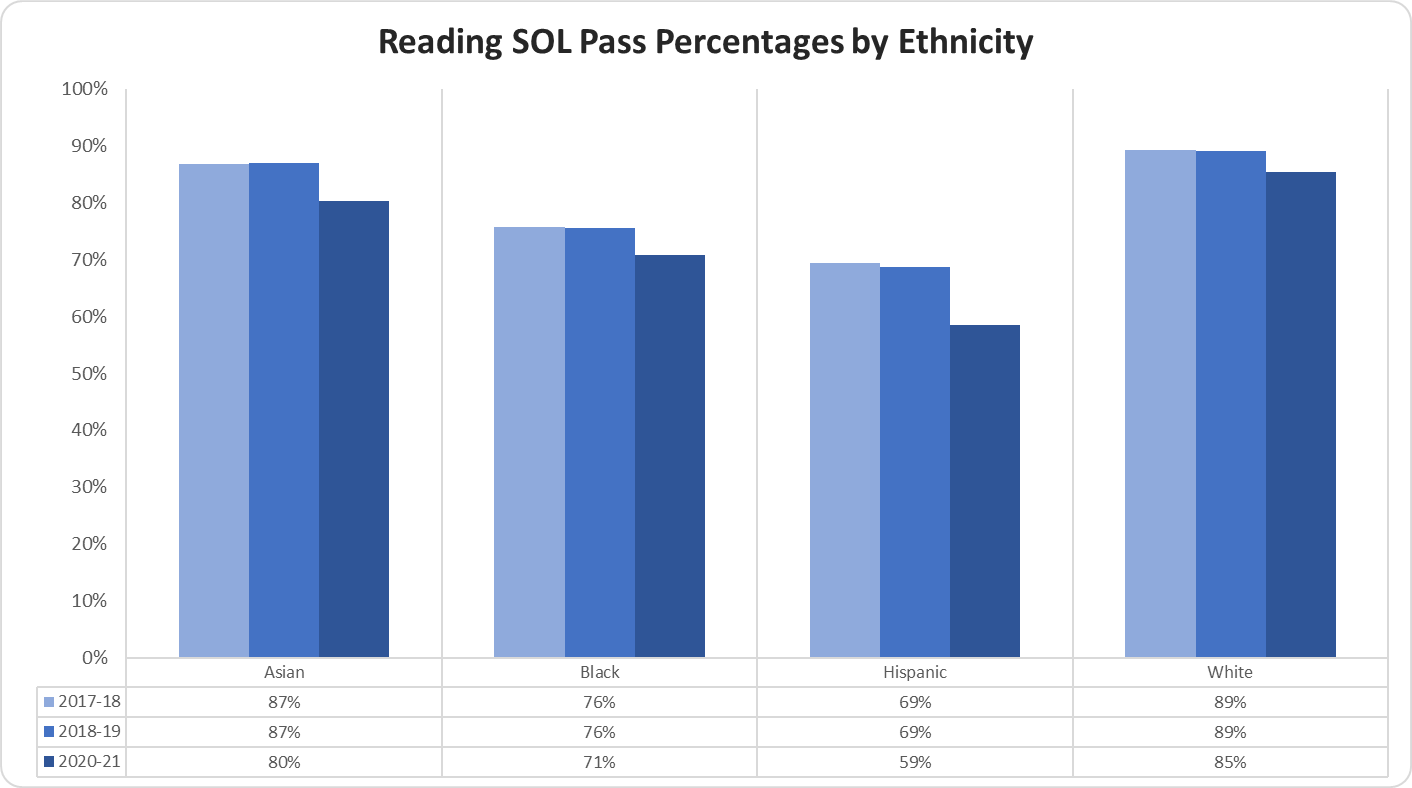
The Reading SOL Pass Percentages by Ethnicity graph displays the percentage of students that passed the reading SOL for the most recent three years.
The percentage of Asian students that passed the reading SOL in 2017-18 was 87%, 2018-19 was 87%, and 2020-21 was 80%; the percentage of black students that passed the reading SOL in 2017-18 was 76%, 2018-19 was 76%, and 2020-21 was 71%; the percentage of Hispanic students that passed the reading SOL in 2017-18 was 69%, 2018-19 was 69%, and 2020-21 was 59%; the percentage of white students that passed the reading SOL in 2017-18 was 89%, 2018-19 was 89%, and 2020-21 was 85%.
Reading SOL Pass Percentages by Student Group
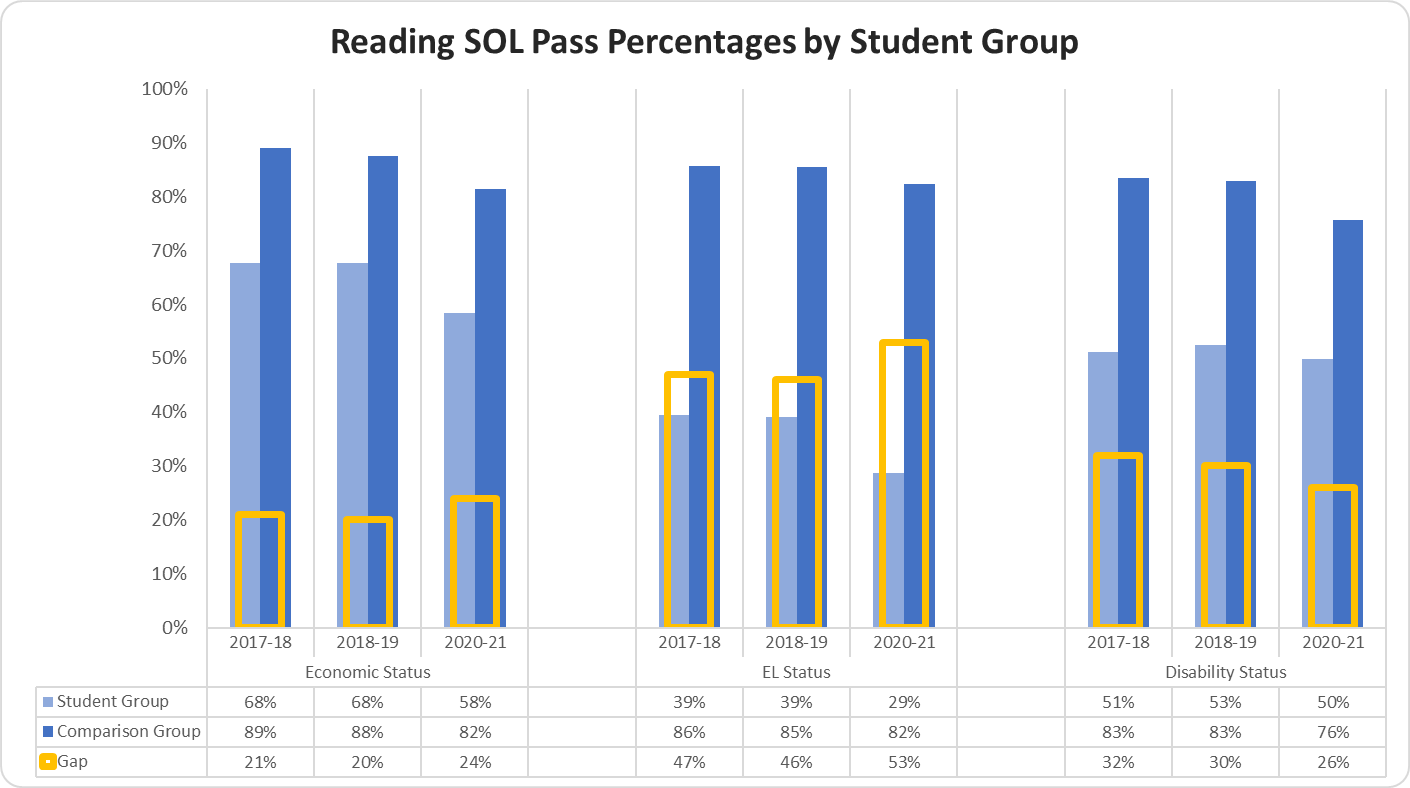
The Reading SOL Pass Percentages by Student Group graph displays the percentage of students that passed the reading SOL for the most recent three years.
The percentage of Economically Disadvantaged students that passed the reading SOL in 2017-18 was 68%, 2018-19 was 68%, and 2020-21 was 58%; the Non-Economically Disadvantaged students that passed the reading SOL in 2017-18 was 89%, 2018-19 was 88%, and 2020-21 was 82%; the gap between the two groups in 2017-18 was 21%, 2018-19 was 20%, and 2020-21 was 24%.
The percentage of EL students that passed the reading SOL in 2017-18 was 39% and in 2018-19 was 39%; the non-EL students that passed the reading SOL in 2017-18 was 86% and in 2018-19 was 85%; the gap between the two groups in 2017-18 was 47% and in 2018-19 was 46%.
The percentage of Students with Disabilities that passed the reading SOL in 2017-18 was 51%, 2018-19 was 53%, and 2020-21 was 50%; the Students without Disabilities that passed the reading SOL in 2017-18 was 83%, 2018-19 was 83%, and 2020-21 was 76%; the gap between the two groups in 2017-18 was 32%, 2018-19 was 30%, and 2020-21 was 26%.
Reading SOL Pass Advanced Percentages by Ethnicity
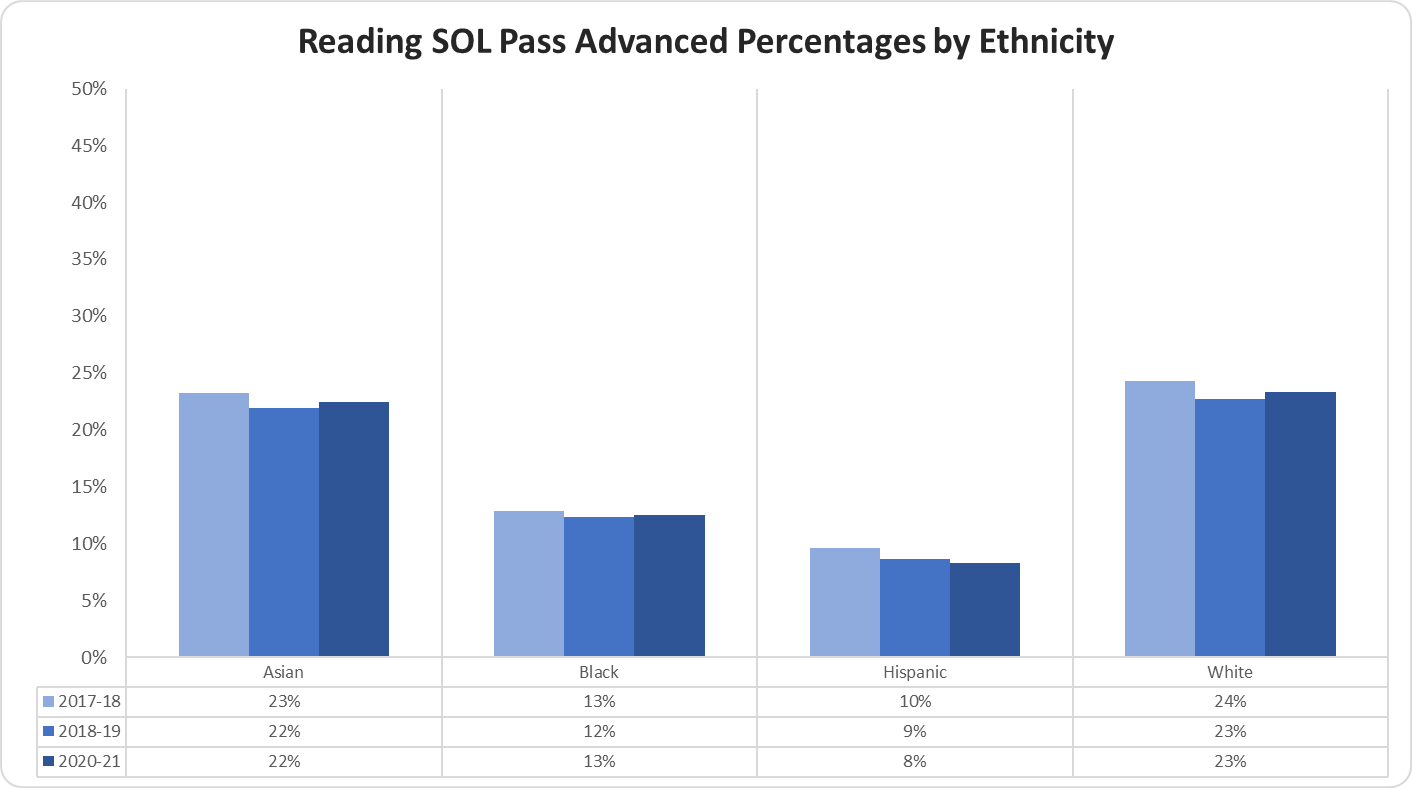
The Reading SOL Pass Advanced Percentages by Ethnicity graph displays the percentage of students that passed the reading SOL at the advanced level for the most recent three years.
The percentage of Asian students that earned a pass advanced score for the reading SOL in 2017-18 was 23%, 2018-19 was 22%, and 2020-21 was 22%; the percentage of black students that earned a pass advanced score for the reading SOL in 2017-18 was 13%, 2018-19 was 12%, and 2020-21 was 13%; the percentage of Hispanic students that advance passed the reading SOL in 2017-18 was 10%, 2018-19 was 9%, and 2020-21 was 8%; the percentage of white students that advance passed the reading SOL in 2017-18 was 24%, 2018-19 was 23%, and 2020-21 was 23%.
Reading SOL Pass Advanced Percentages by Student Group
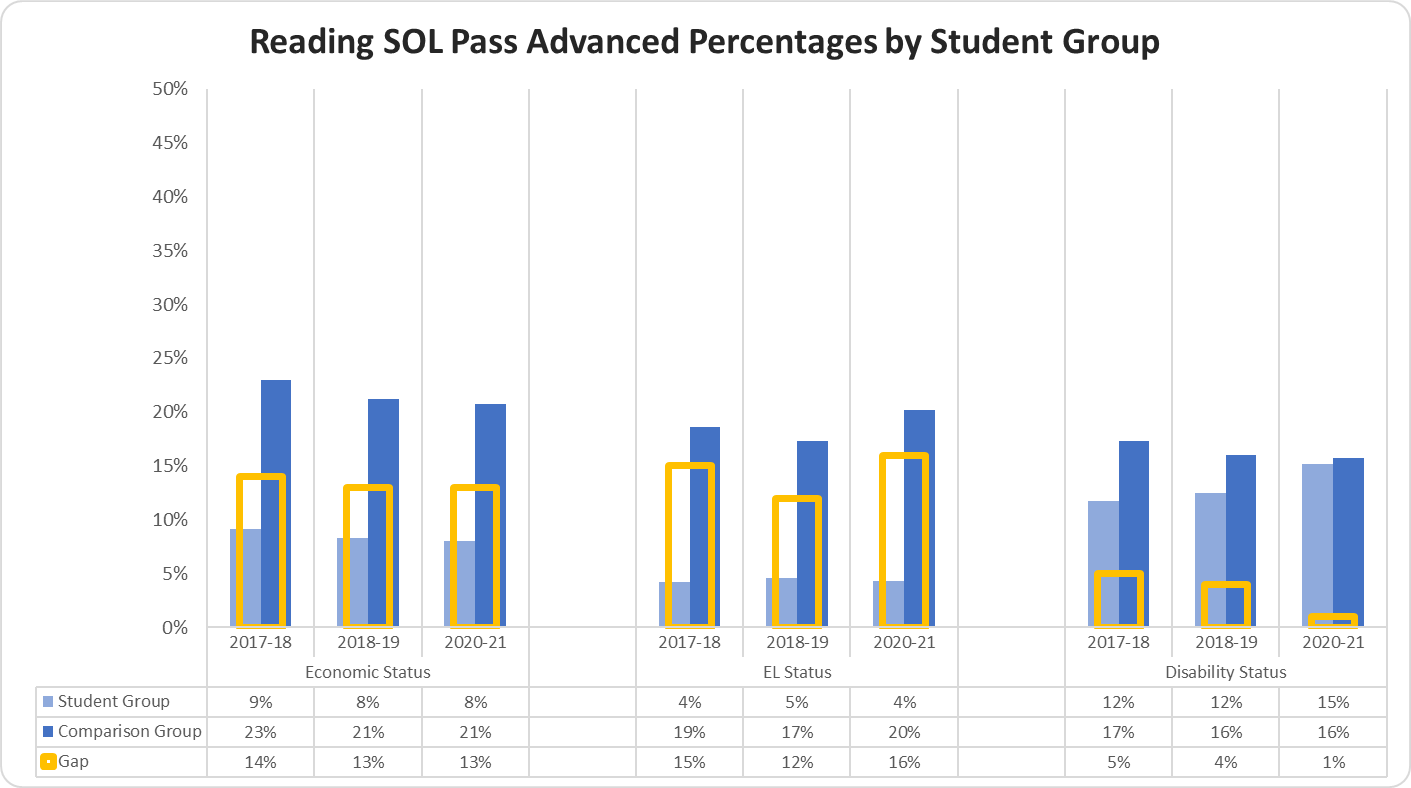
The Reading SOL Pass Advanced Percentages by Student Group graph displays the percentage of students that passed the reading SOL at the advanced level for the most recent three years.
The percentage of Economically Disadvantaged students that earned a pass advanced score for the reading SOL in 2017-18 was 9%, 2018-19 was 8%, and 2020-21 was 8%; the Non-Economically Disadvantaged students that earned a pass advanced score for the reading SOL in 2017-18 was 23%, 2018-19 was 21%, and 2020-21 was 21%; the gap between the two groups in 2017-18 was 14%, 2018-19 was 13%, and 2020-21 was 13%.
The percentage of EL students that earned a pass advanced score for the reading SOL in 2017-18 was 4%, 2018-19 was 5%, and 2020-21 was 4%; the Non-EL students that earned a pass advanced score for the reading SOL in 2017-18 was 19%, 2018-19 was 17%, and 2020-21 was 20%; the gap between the two groups in 2017-18 was 15%, 2018-19 was 12%, and 2020-21 was 16%.
The percentage of Students with Disabilities that earned a pass advanced score for the reading SOL in 2017-18 was 12%, 2018-19 was 12%, and 2020-21 was 15%; the Students without Disabilities that earned a pass advanced score for the reading SOL in 2017-18 was 17%, 2018-19 was 16%, and 2020-21 was 16%; the gap between the two groups in 2017-18 was 5%, 2018-19 was 4%, and 2020-21 was 1%.
Math
Math SOL Pass Percentages by Ethnicity
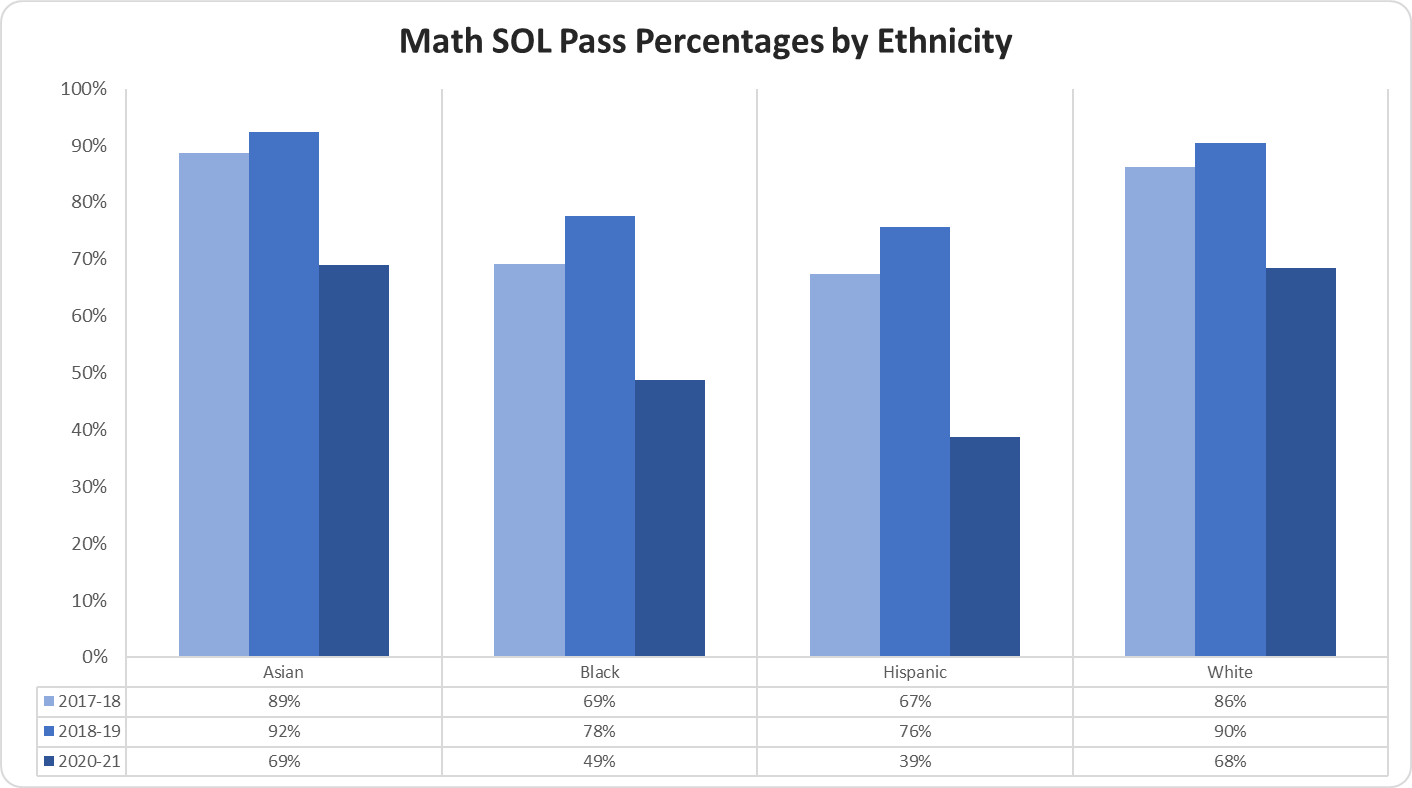
The Math SOL Pass Percentages by Ethnicity graph displays the percentage of students that passed the math SOL for the most recent three years.
The percentage of Asian students that passed the math SOL in 2017-18 was 89%, 2018-19 was 92%, and 2020-21 was 69%; the percentage of black students that passed the math SOL in 2017-18 was 69%, 2018-19 was 78%, and 2020-21 was 49%; the percentage of Hispanic students that passed the math SOL in 2017-18 was 67%, 2018-19 was 76%, and 2020-21 was 39%; the percentage of white students that passed the math SOL in 2017-18 was 86%, 2018-19 was 90%, and 2020-21 was 68%.
Math SOL Pass Percentages by Student Group
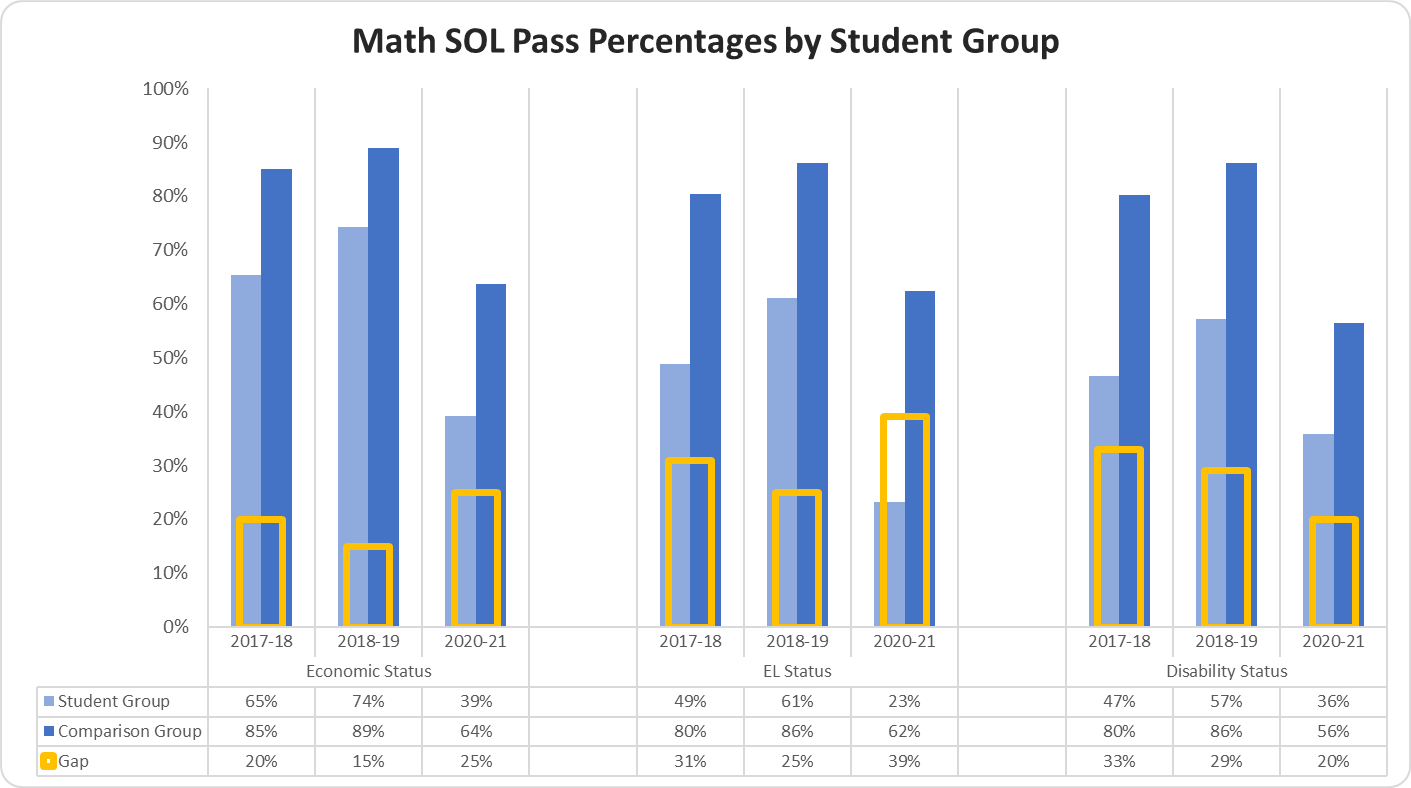
The Math SOL Pass Percentages by Student Group graph displays the percentage of students that passed the math SOL for the most recent three years.
The percentage of Economically Disadvantaged students that passed the math SOL in 2017-18 was 65%, 2018-19 was 74%, and 2020-21 was 39%; the Non-Economically Disadvantaged students that passed the math SOL in 2017-18 was 85%, 2018-19 was 89%, and 2020-21 was 64%; the gap between the two groups in 2017-18 was 20%, 2018-19 was 15%, and 2020-21 was 25%.
The percentage of EL students that passed the math SOL in 2017-18 was 49%, 2018-19 was 61%, and 2020-21 was 23%; the Non-EL students that passed the math SOL in 2017-18 was 80%, 2018-19 was 86%, and 2020-21 was 62%; the gap between the two groups in 2017-18 was 31%, 2018-19 was 25%, and 2020-21 was 39%.
The percentage of Students with Disabilities that passed the math SOL in 2017-18 was 47%, 2018-19 was 57%, and 2020-21 was 36%; the Students without Disabilities that passed the math SOL in 2017-18 was 80%, 2018-19 was 86%, and 2020-21 was 56%; the gap between the two groups in 2017-18 was 33%, 2018-19 was 29%, and 2020-21 was 20%.
Math SOL Pass Advanced Percentages by Ethnicity
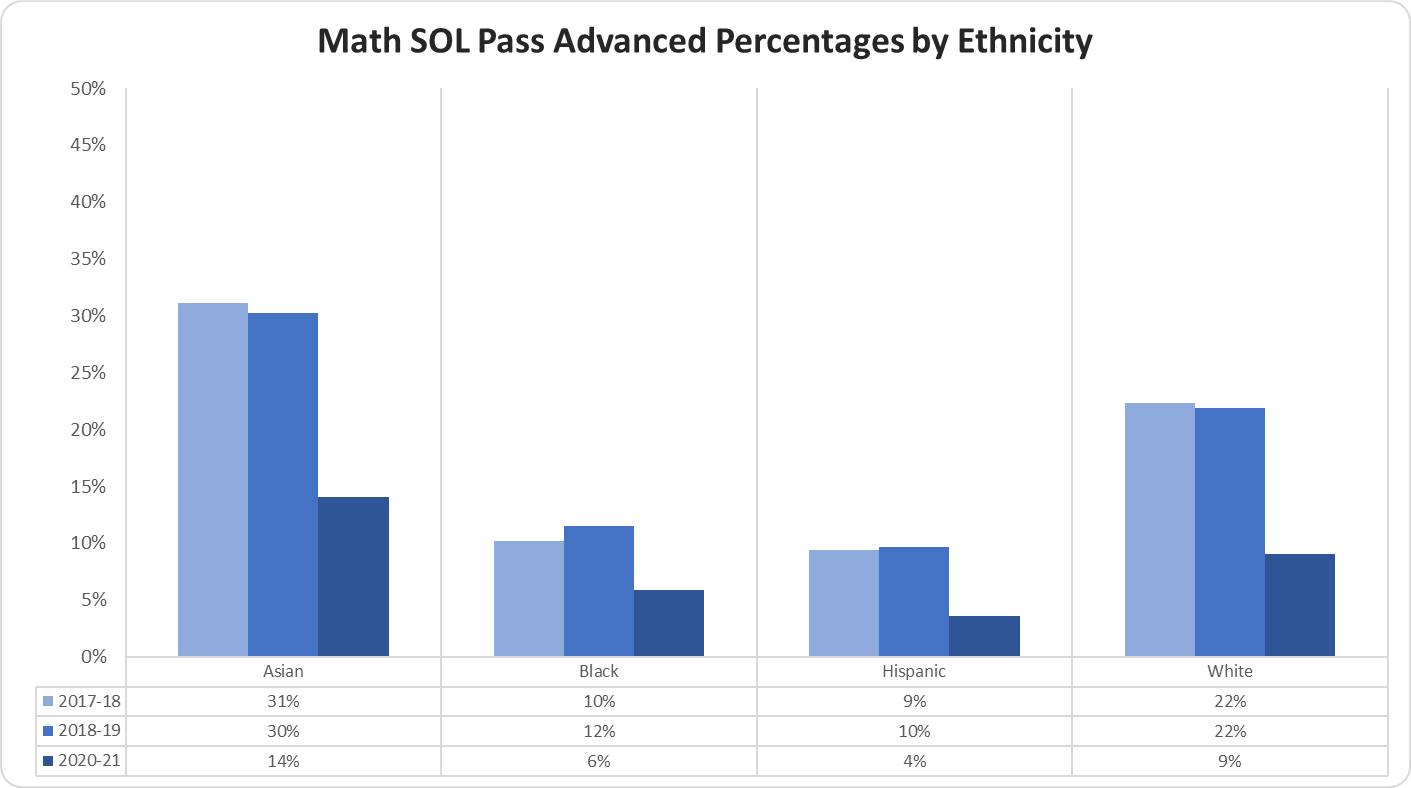
The Math SOL Pass Advanced Percentages by Ethnicity graph displays the percentage of students that passed the math SOL at the advanced level for the most recent three years.
The percentage of Asian students that earned a pass advanced score for the math SOL in 2017-18 was 31%, 2018-19 was 30%, and 2020-21 was 14%; the percentage of black students that earned a pass advanced score for the math SOL in 2017-18 was 10%, 2018-19 was 12%, and 2020-21 was 6%; the percentage of Hispanic students that advance passed the math SOL in 2017-18 was 9%, 2018-19 was 10%, and 2020-21 was 4%; the percentage of white students that advance passed the math SOL in 2017-18 was 22%, 2018-19 was 22%, and 2020-21 was 9%.
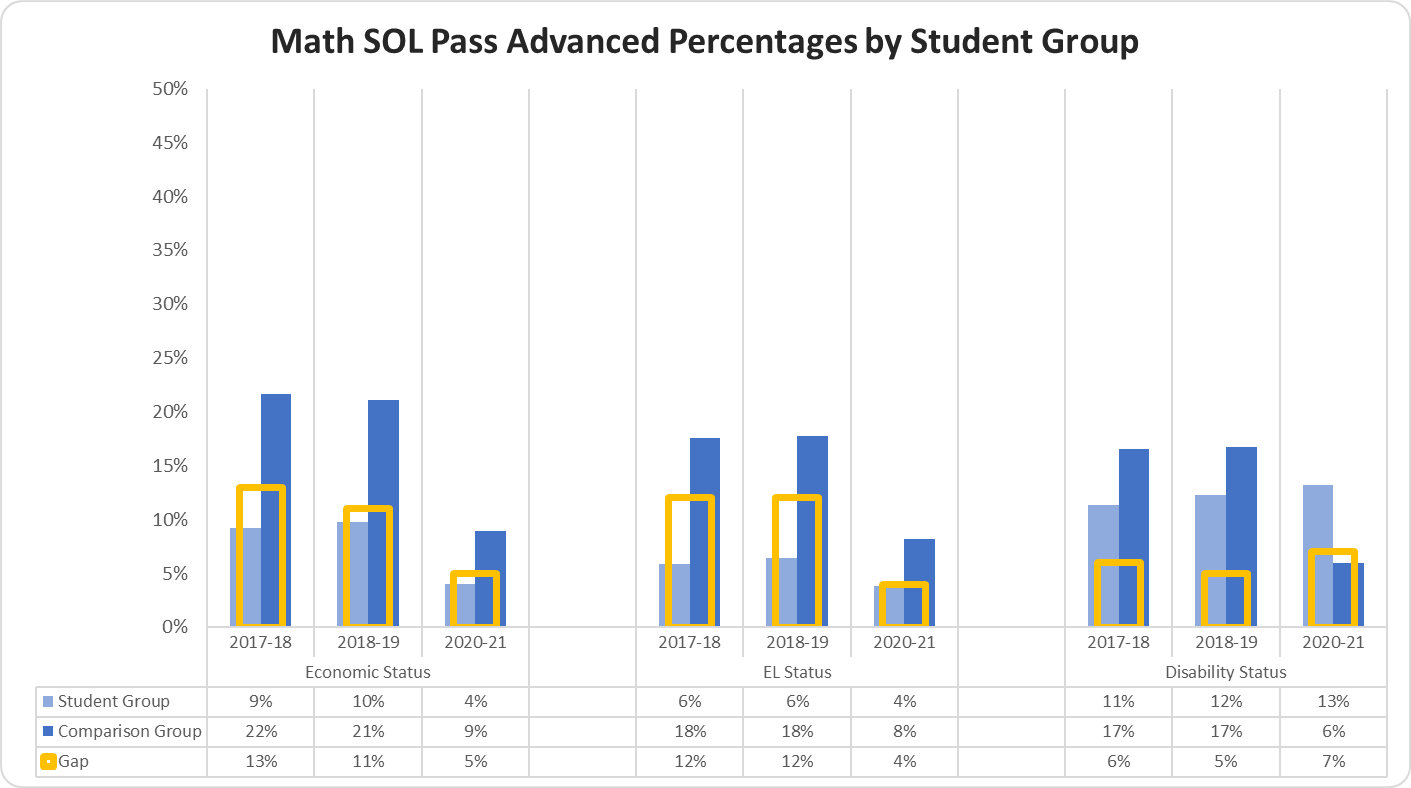
Math SOL Pass Advanced Percentages by Student Group
The Math SOL Pass Advanced Percentages by Student Group graph displays the percentage of students that passed the math SOL at the advanced level for the most recent three years.
The percentage of Economically Disadvantaged students that earned a pass advanced score for the math SOL in 2017-18 was 9%, 2018-19 was 10%, and 2020-21 was 4%; the Non-Economically Disadvantaged students that earned a pass advanced score for the math SOL in 2017-18 was 22%, 2018-19 was 21%, and 2020-21 was 9%; the gap between the two groups in 2017-18 was 13%, 2018-19 was 11%, and 2020-21 was 5%.
The percentage of EL students that earned a pass advanced score for the math SOL in 2017-18 was 6%, 2018-19 was 6%, and 2020-21 was 4%; the Non-EL students that earned a pass advanced score for the math SOL in 2017-18 was 18%, 2018-19 was 18%, and 2020-21 was 8%; the gap between the two groups in 2017-18 was 12%, 2018-19 was 12%, and 2020-21 was 4%.
The percentage of Students with Disabilities that earned a pass advanced score for the math SOL in 2017-18 was 11%, 2018-19 was 12%, and 2020-21 was 13%; the Students without Disabilities that earned a pass advanced score for the math SOL in 2017-18 was 17%, 2018-19 was 17%, and 2020-21 was 6%; the gap between the two groups in 2017-18 was 6%, 2018-19 was 5%, and 2020-21 was 7%.
Science
Science SOL Pass Percentages by Ethnicity
The Science SOL Pass Percentages by Ethnicity graph displays the percentage of students that passed the science SOL for the most recent three years.
The percentage of Asian students that passed the science SOL in 2017-18 was 90%, 2018-19 was 91%, and 2020-21 was 69%; the percentage of black students that passed the science SOL in 2017-18 was 76%, 2018-19 was 77%, and 2020-21 was 51%; the percentage of Hispanic students that passed the science SOL in 2017-18 was 72%, 2018-19 was 72%, and 2020-21 was 40%; the percentage of white students that passed the science SOL in 2017-18 was 92%, 2018-19 was 92%, and 2020-21 was 74%.
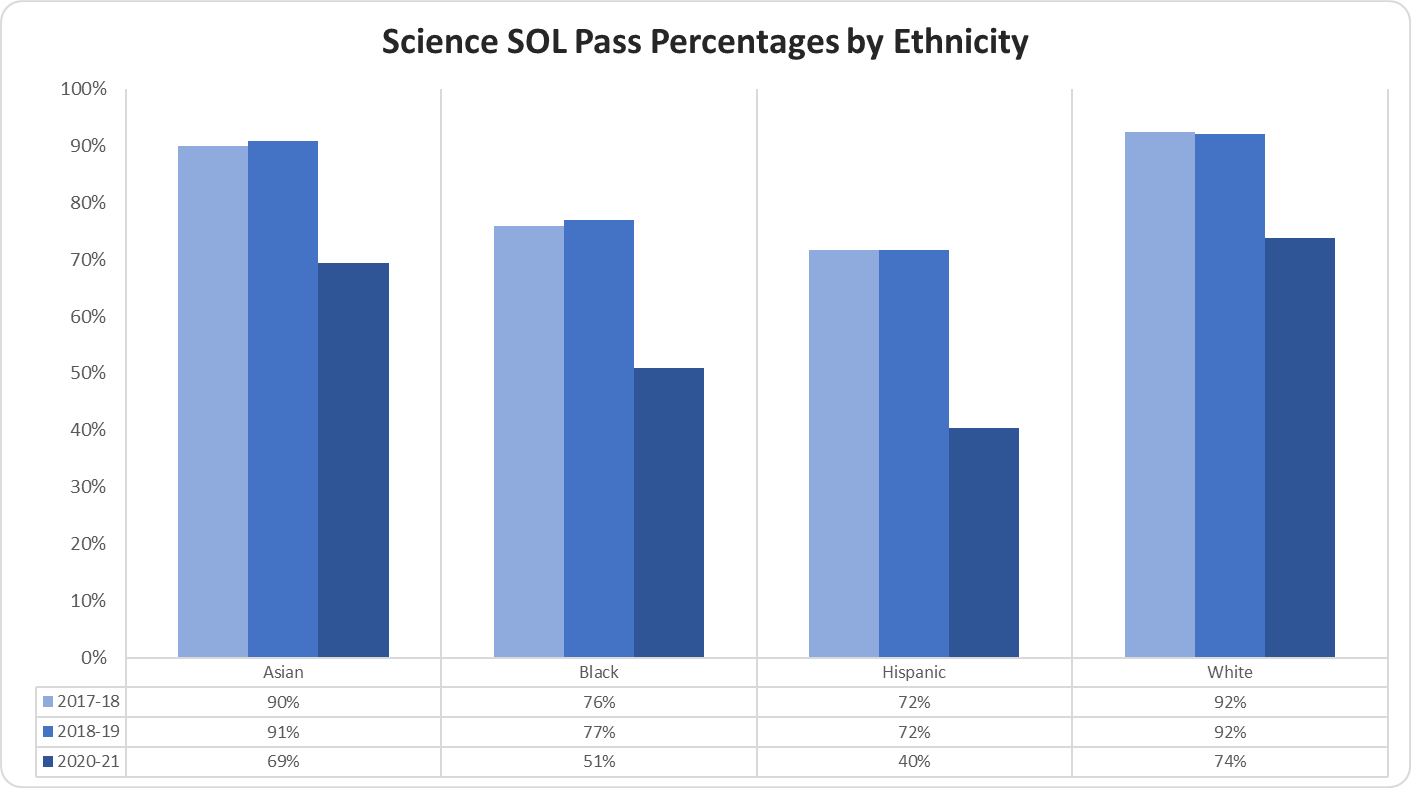
Science SOL Pass Percentages by Student Group
The Science SOL Pass Percentages by Student Group graph displays the percentage of students that passed the science SOL for the most recent three years.
The percentage of Economically Disadvantaged students that passed the science SOL in 2017-18 was 70%, 2018-19 was 70%, and 2020-21 was 40%; the Non-Economically Disadvantaged students that passed the science SOL in 2017-18 was 91%, 2018-19 was 90%, and 2020-21 was 68%; the gap between the two groups in 2017-18 was 21%, 2018-19 was 20%, and 2020-21 was 28%.
The percentage of EL students that passed the science SOL in 2017-18 was 37%, 2018-19 was 41%, and 2020-21 was 12%; the Non-EL students that passed the science SOL in 2017-18 was 87%, 2018-19 was 87%, and 2020-21 was 67%; the gap between the two groups in 2017-18 was 50%, 2018-19 was 46%, and 2020-21 was 55%.
The percentage of Students with Disabilities that passed the science SOL in 2017-18 was 51%, 2018-19 was 53%, and 2020-21 was 34%; the Students without Disabilities that passed the science SOL in 2017-18 was 85%, 2018-19 was 85%, and 2020-21 was 60%; the gap between the two groups in 2017-18 was 34%, 2018-19 was 32%, and 2020-21 was 26%.
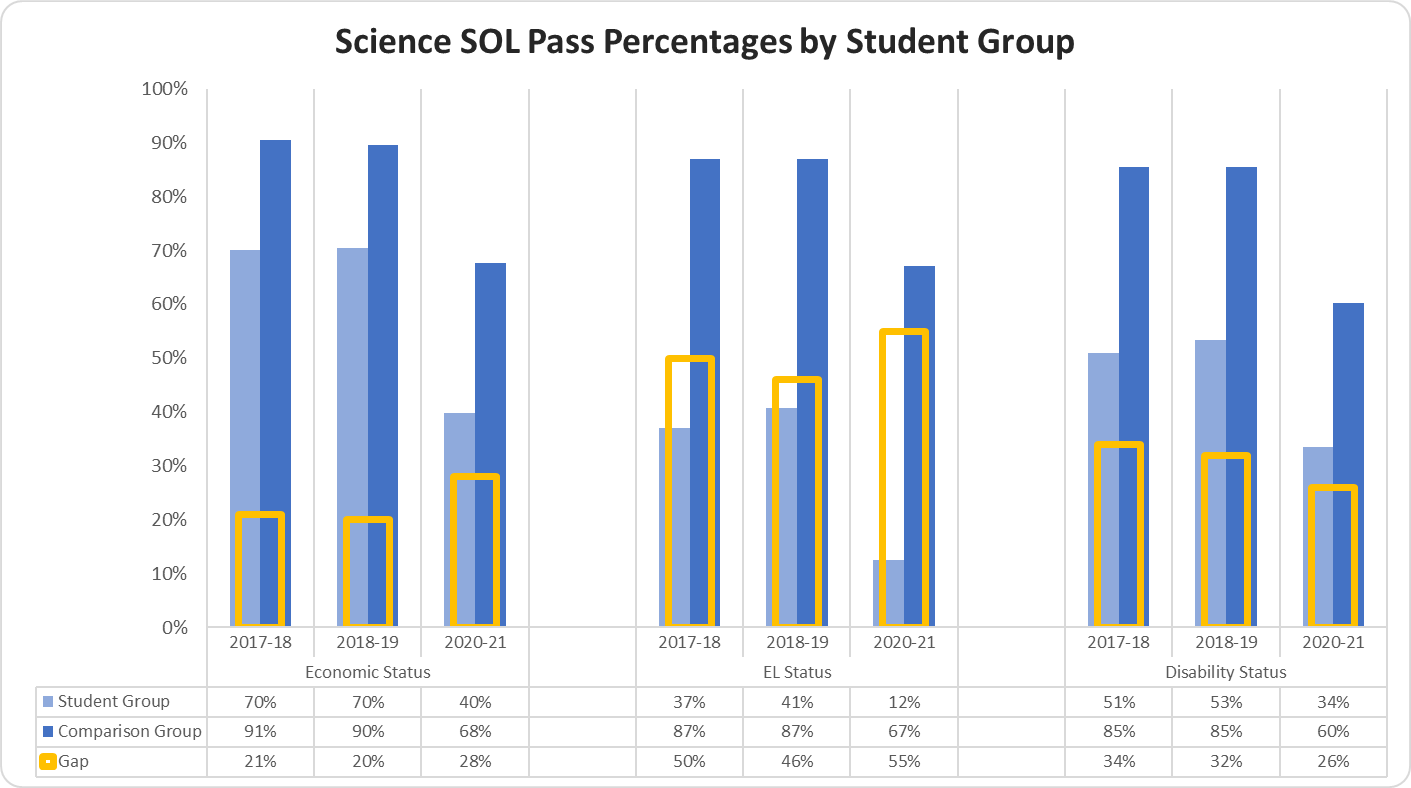
Science SOL Pass Advanced Percentages by Ethnicity
The Science SOL Pass Advanced Percentages by Ethnicity graph displays the percentage of students that passed the science SOL at the advanced level for the most recent three years.
The percentage of Asian students that earned a pass advanced score for the science SOL in 2017-18 was 26%, 2018-19 was 28%, and 2020-21 was 14%; the percentage of black students that earned a pass advanced score for the science SOL in 2017-18 was 8%, 2018-19 was 11%, and 2020-21 was 6%; the percentage of Hispanic students that advance passed the science SOL in 2017-18 was 7%, 2018-19 was 9%, and 2020-21 was 3%; the percentage of white students that advance passed the science SOL in 2017-18 was 22%, 2018-19 was 26%, and 2020-21 was 13%.
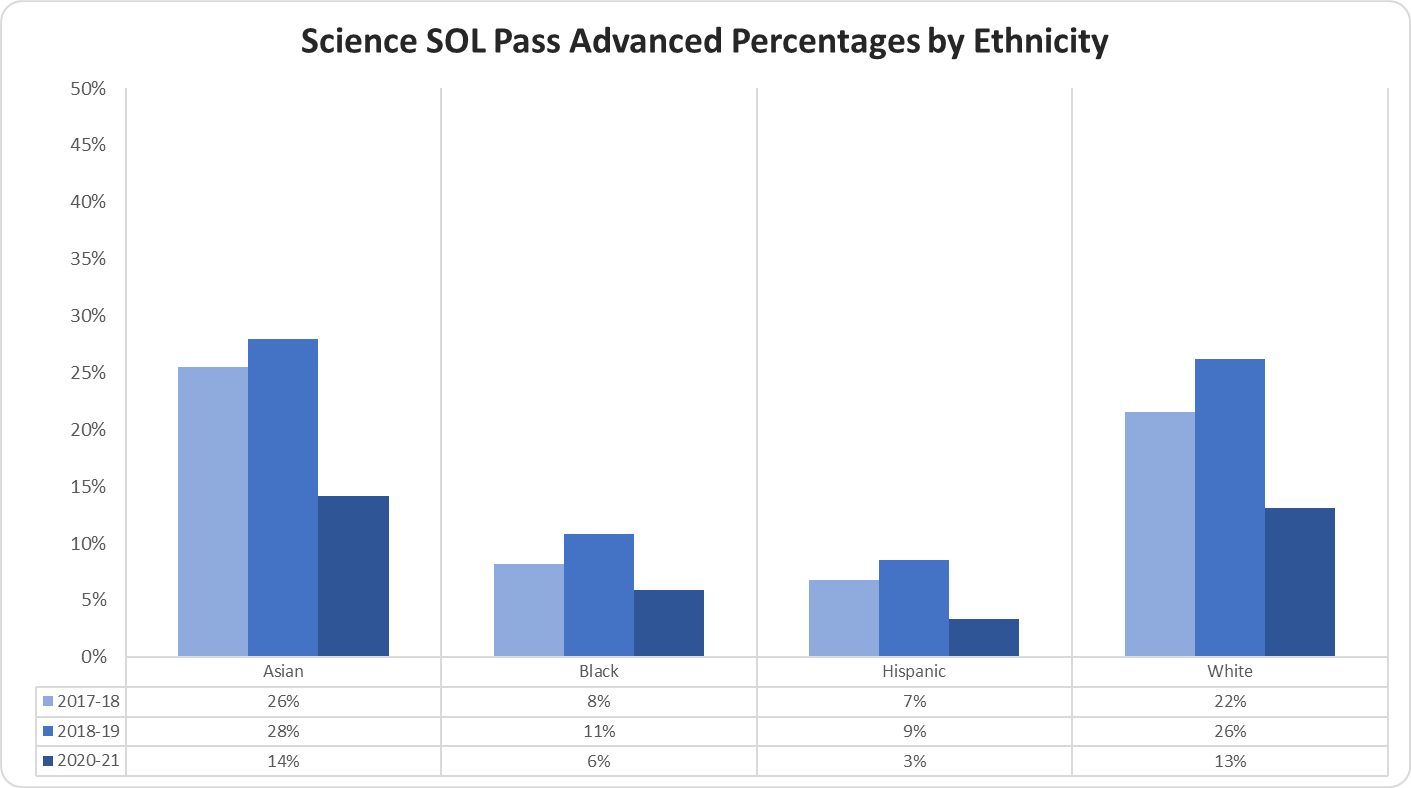
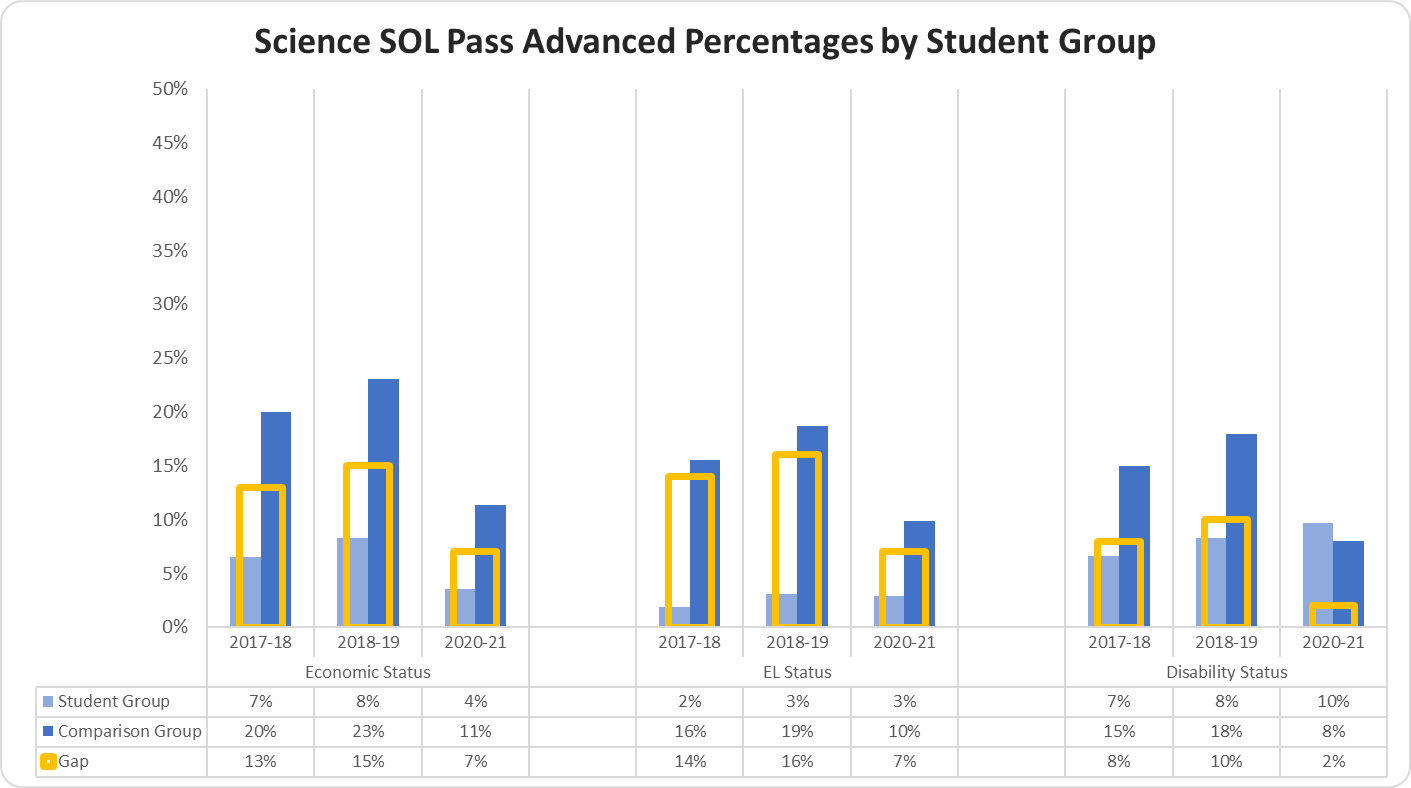
Science SOL Pass Advanced Percentages by Student Group
The Science SOL Pass Advanced Percentages by Student Group graph displays the percentage of students that passed the science SOL at the advanced level for the most recent three years.
The percentage of Economically Disadvantaged students that earned a pass advanced score for the science SOL in 2017-18 was 7%, 2018-19 was 8%, and 2020-21 was 4%; the Non-Economically Disadvantaged students that earned a pass advanced score for the science SOL in 2017-18 was 20%, 2018-19 was 23%, and 2020-21 was 11%; the gap between the two groups in 2017-18 was 13%, 2018-19 was 15%, and 2020-21 was 7%.
The percentage of EL students that earned a pass advanced score for the science SOL in 2017-18 was 2%, 2018-19 was 3%, and 2020-21 was 3%; the Non-EL students that earned a pass advanced score for the science SOL in 2017-18 was 16%, 2018-19 was 19%, and 2020-21 was 10%; the gap between the two groups in 2017-18 was 14%, 2018-19 was 16%, and 2020-21 was 7%.
The percentage of Students with Disabilities that earned a pass advanced score for the science SOL in 2017-18 was 7%, 2018-19 was 8%, and 2020-21 was 10%; the Students without Disabilities that earned a pass advanced score for the science SOL in 2017-18 was 15%, 2018-19 was 18%, and 2020-21 was 8%; the gap between the two groups in 2017-18 was 8%, 2018-19 was 10%, and 2020-21 was 2%.
History
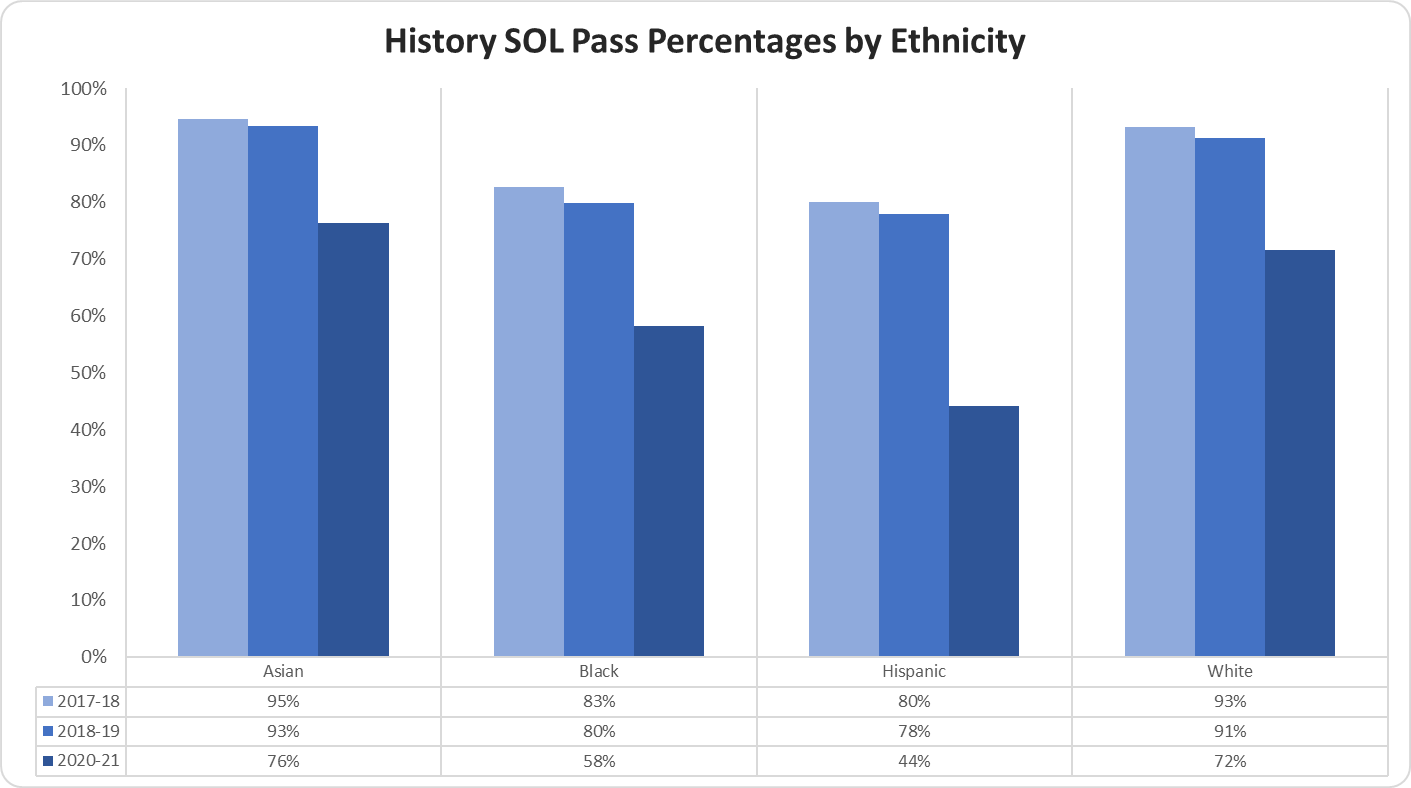
History SOL Pass Percentages by Ethnicity
The History SOL Pass Percentages by Ethnicity graph displays the percentage of students that passed the history SOL for the most recent three years.
The percentage of Asian students that passed the history SOL in 2017-18 was 95%, 2018-19 was 93%, and 2020-21 was 76%; the percentage of black students that passed the history SOL in 2017-18 was 83%, 2018-19 was 80%, and 2020-21 was 58%; the percentage of Hispanic students that passed the history SOL in 2017-18 was 80%, 2018-19 was 78%, and 2020-21 was 44%; the percentage of white students that passed the history SOL in 2017-18 was 93%, 2018-19 was 91%, and 2020-21 was 72%.
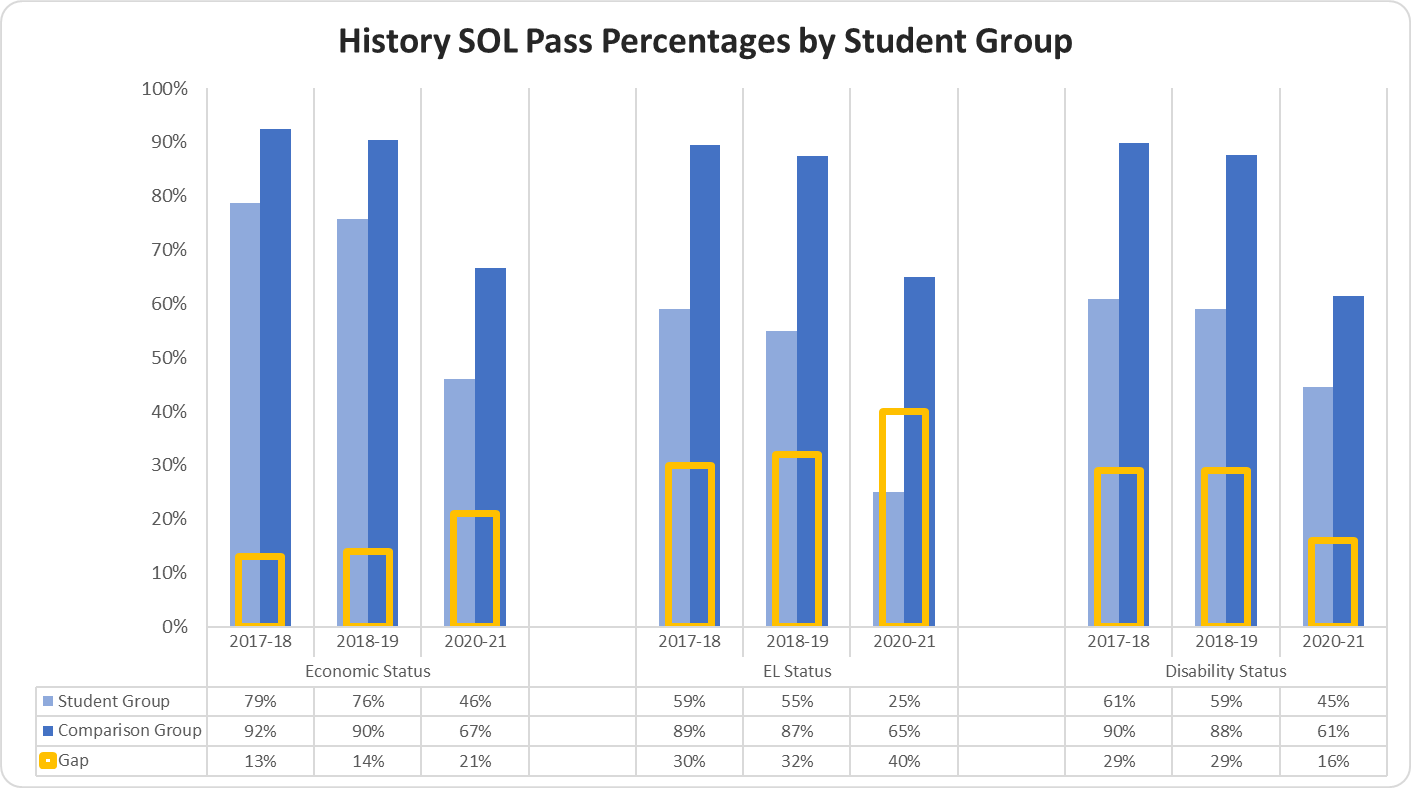
History SOL Pass Percentages by Student Group
The History SOL Pass Percentages by Student Group graph displays the percentage of students that passed the history SOL for the most recent three years.
The percentage of Economically Disadvantaged students that passed the history SOL in 2017-18 was 79%, 2018-19 was 76%, and 2020-21 was 46%; the Non-Economically Disadvantaged students that passed the history SOL in 2017-18 was 92%, 2018-19 was 90%, and 2020-21 was 67%; the gap between the two groups in 2017-18 was 13%, 2018-19 was 14%, and 2020-21 was 21%.
The percentage of EL students that passed the history SOL in 2017-18 was 59%, 2018-19 was 55%, and 2020-21 was 25%; the Non-EL students that passed the history SOL in 2017-18 was 89%, 2018-19 was 87%, and 2020-21 was 65%; the gap between the two groups in 2017-18 was 30%, 2018-19 was 32%, and 2020-21 was 40%.
The percentage of Students with Disabilities that passed the history SOL in 2017-18 was 61%, 2018-19 was 59%, and 2020-21 was 45%; the Students without Disabilities that passed the history SOL in 2017-18 was 90%, 2018-19 was 88%, and 2020-21 was 61%; the gap between the two groups in 2017-18 was 29%, 2018-19 was 29%, and 2020-21 was 16%.
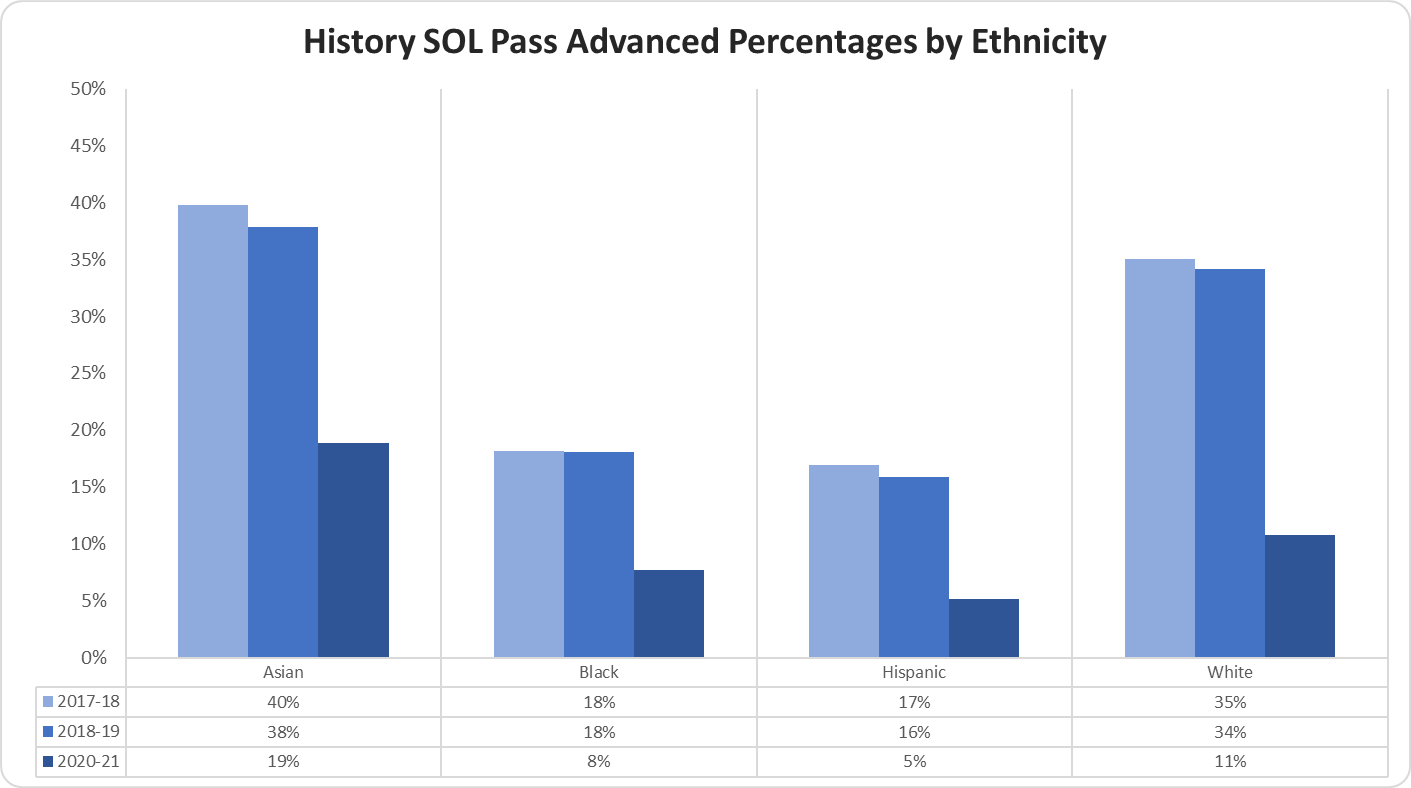
History SOL Pass Advanced Percentages by Ethnicity
The History SOL Pass Advanced Percentages by Ethnicity graph displays the percentage of students that passed the history SOL at the advanced level for the most recent three years.
The percentage of Asian students that earned a pass advanced score for the history SOL in 2017-18 was 40%, 2018-19 was 38%, and 2020-21 was 19%; the percentage of black students that earned a pass advanced score for the history SOL in 2017-18 was 18%, 2018-19 was 18%, and 2020-21 was 8%; the percentage of Hispanic students that advance passed the history SOL in 2017-18 was 17%, 2018-19 was 16%, and 2020-21 was 5%; the percentage of white students that advance passed the history SOL in 2017-18 was 35%, 2018-19 was 34%, and 2020-21 was 11%.
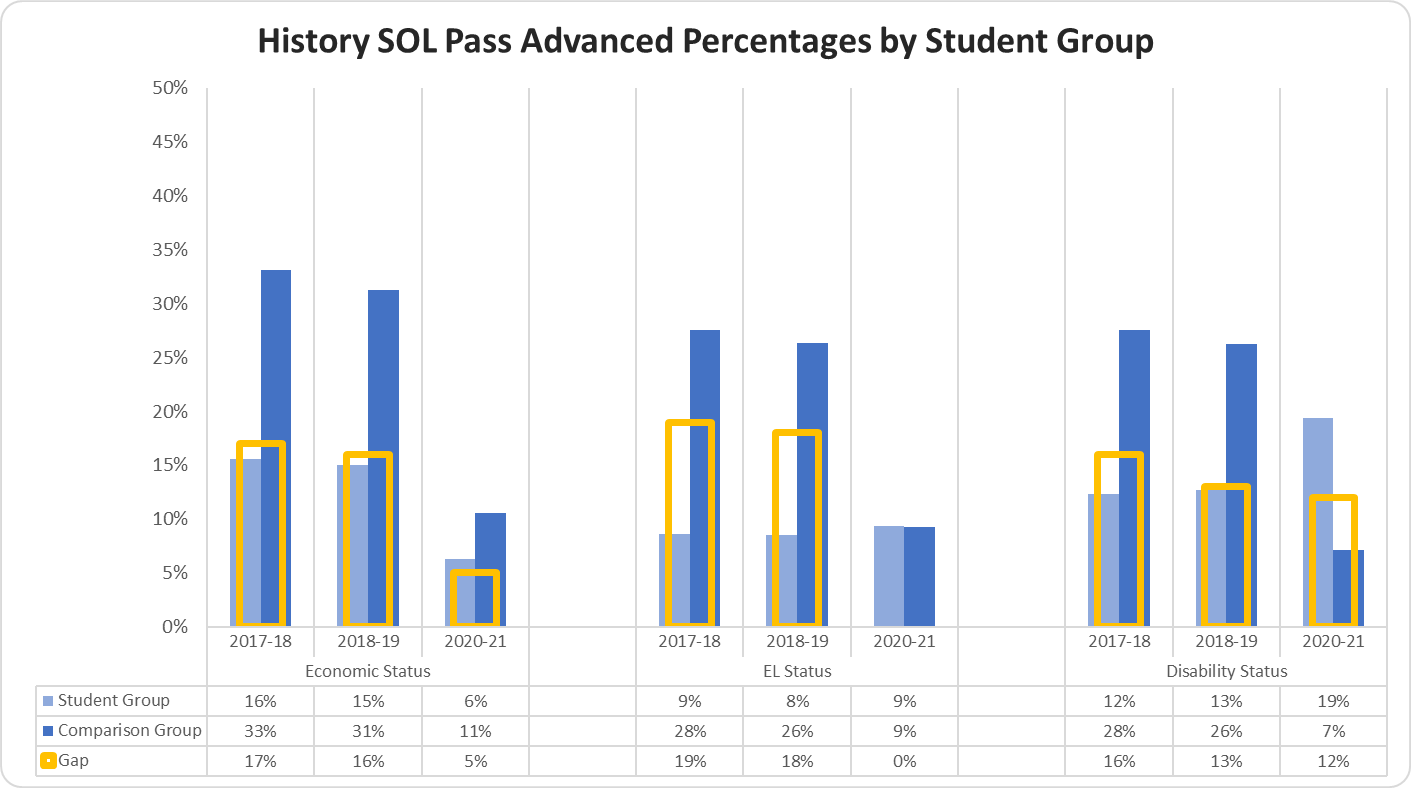
History SOL Pass Advanced Percentages by Student Group
The History SOL Pass Advanced Percentages by Student Group graph displays the percentage of students that passed the history SOL at the advanced level for the most recent three years.
The percentage of Economically Disadvantaged students that earned a pass advanced score for the history SOL in 2017-18 was 16%, 2018-19 was 15%, and 2020-21 was 6%; the Non-Economically Disadvantaged students that earned a pass advanced score for the history SOL in 2017-18 was 33%, 2018-19 was 31%, and 2020-21 was 11%; the gap between the two groups in 2017-18 was 17%, 2018-19 was 16%, and 2020-21 was 5%.
The percentage of EL students that earned a pass advanced score for the history SOL in 2017-18 was 9%, 2018-19 was 8%, and 2020-21 was 9%; the Non-EL students that earned a pass advanced score for the history SOL in 2017-18 was 28%, 2018-19 was 26%, and 2020-21 was 9%; the gap between the two groups in 2017-18 was 19%, 2018-19 was 18%, and 2020-21 was 0%.
The percentage of Students with Disabilities that earned a pass advanced score for the history SOL in 2017-18 was 12%, 2018-19 was 13%, and 2020-21 was 19%; the Students without Disabilities that earned a pass advanced score for the history SOL in 2017-18 was 28%, 2018-19 was 26%, and 2020-21 was 7%; the gap between the two groups in 2017-18 was 16%, 2018-19 was 13%, and 2020-21 was 12%.
Writing
Writing SOL Pass Percentages by Ethnicity
The Writing SOL Pass Percentages by Ethnicity graph displays the percentage of students that passed the writing SOL for the most recent three years.
The percentage of Asian students that passed the writing SOL in 2017-18 was 90%, 2018-19 was 89%, and 2020-21 was 86%; the percentage of black students that passed the writing SOL in 2017-18 was 74%, 2018-19 was 71%, and 2020-21 was 75%; the percentage of Hispanic students that passed the writing SOL in 2017-18 was 72%, 2018-19 was 70%, and 2020-21 was 67%; the percentage of white students that passed the writing SOL in 2017-18 was 89%, 2018-19 was 87%, and 2020-21 was 90%.
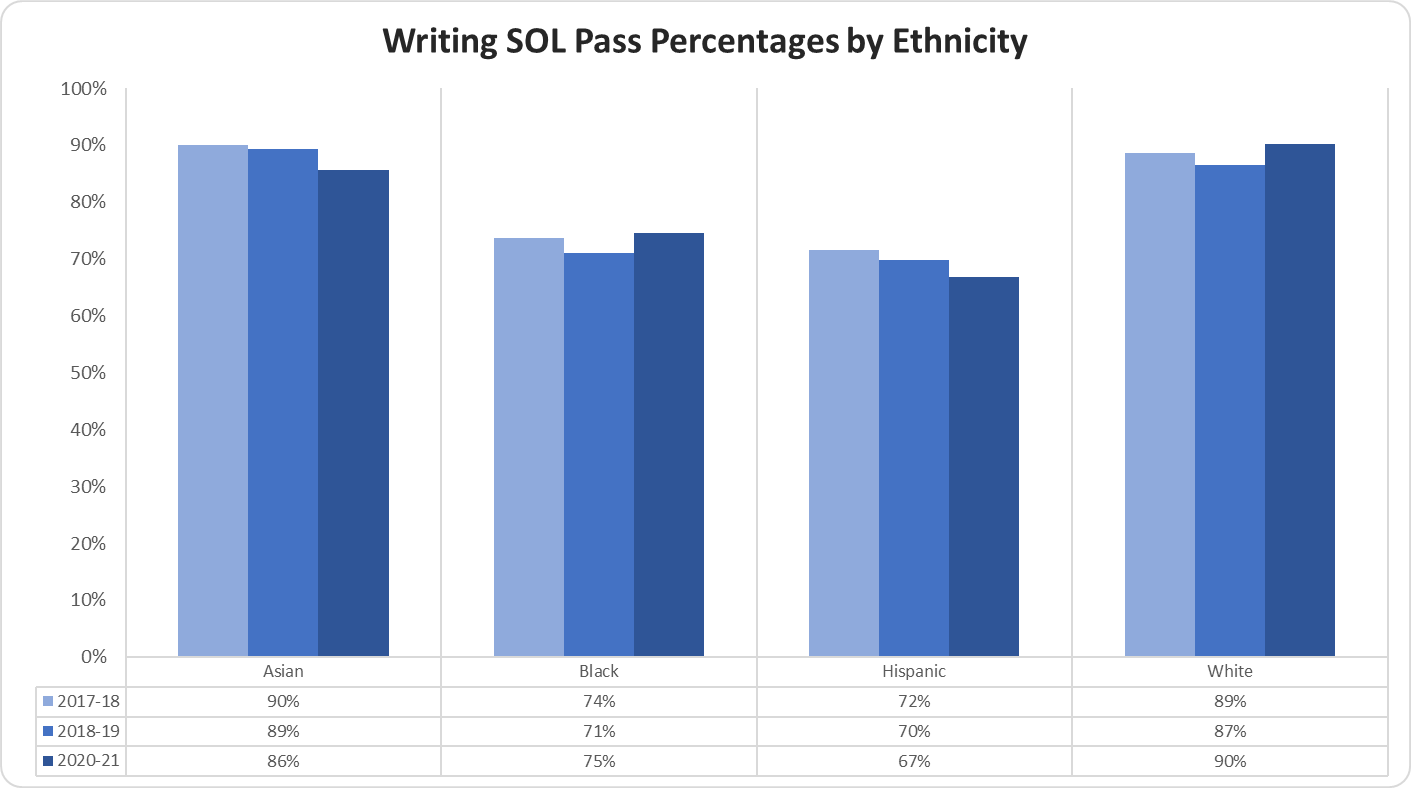
Writing SOL Pass Percentages by Student Group
The Writing SOL Pass Percentages by Student Group graph displays the percentage of students that passed the writing SOL for the most recent three years.
The percentage of Economically Disadvantaged students that passed the writing SOL in 2017-18 was 69%, 2018-19 was 67%, and 2020-21 was 64%; the Non-Economically Disadvantaged students that passed the writing SOL in 2017-18 was 88%, 2018-19 was 85%, and 2020-21 was 85%; the gap between the two groups in 2017-18 was 19%, 2018-19 was 18%, and 2020-21 was 21%.
The percentage of EL students that passed the writing SOL in 2017-18 was 23%, 2018-19 was 27%, and 2020-21 was 18%; the Non-EL students that passed the writing SOL in 2017-18 was 83%, 2018-19 was 81%, and 2020-21 was 85%; the gap between the two groups in 2017-18 was 60%, 2018-19 was 54%, and 2020-21 was 67%.
The percentage of Students with Disabilities that passed the writing SOL in 2017-18 was 44%, 2018-19 was 43%, and 2020-21 was 50%; the Students without Disabilities that passed the writing SOL in 2017-18 was 85%, 2018-19 was 82%, and 2020-21 was 83%; the gap between the two groups in 2017-18 was 41%, 2018-19 was 39%, and 2020-21 was 33%.
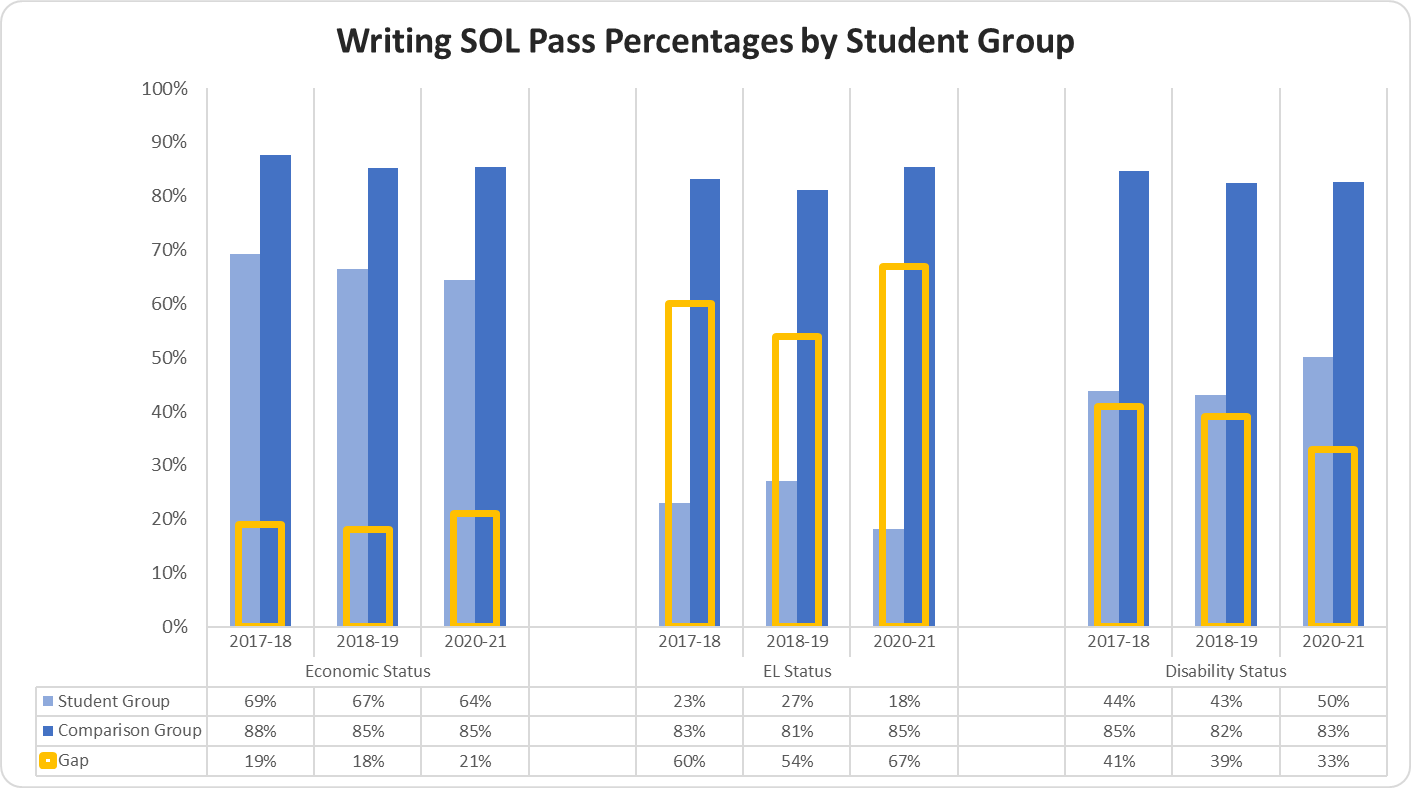
Writing SOL Pass Advanced Percentages by Ethnicity
The Writing SOL Pass Advanced Percentages by Ethnicity graph displays the percentage of students that passed the writing SOL at the advanced level for the most recent three years.
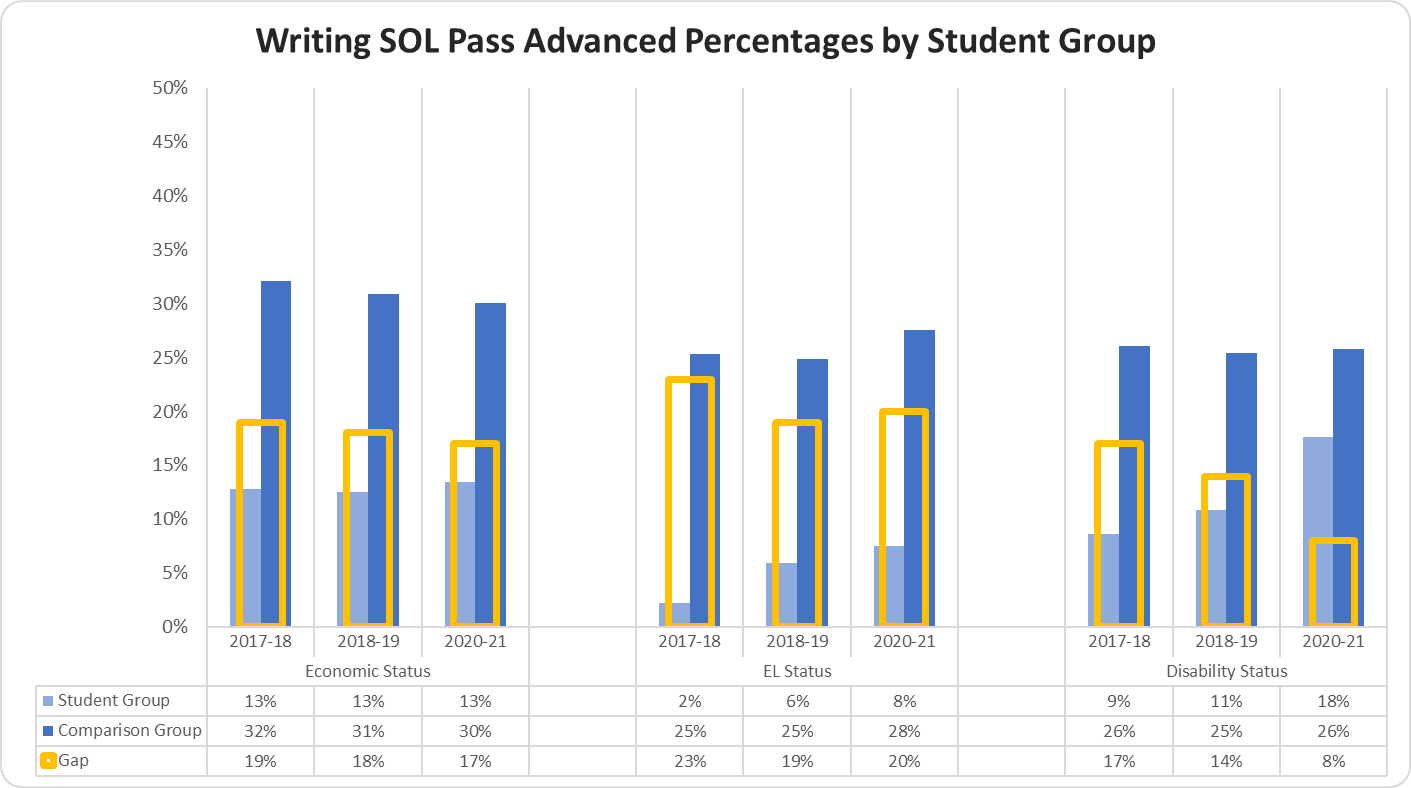
The percentage of Asian students that earned a pass advanced score for the writing SOL in 2017-18 was 41%, 2018-19 was 39%, and 2020-21 was 41%; the percentage of black students that earned a pass advanced score for the writing SOL in 2017-18 was 14%, 2018-19 was 16%, and 2020-21 was 19%; the percentage of Hispanic students that advance passed the writing SOL in 2017-18 was 13%, 2018-19 was 14%, and 2020-21 was 13%; the percentage of white students that advance passed the writing SOL in 2017-18 was 35%, 2018-19 was 33%, and 2020-21 was 34%.
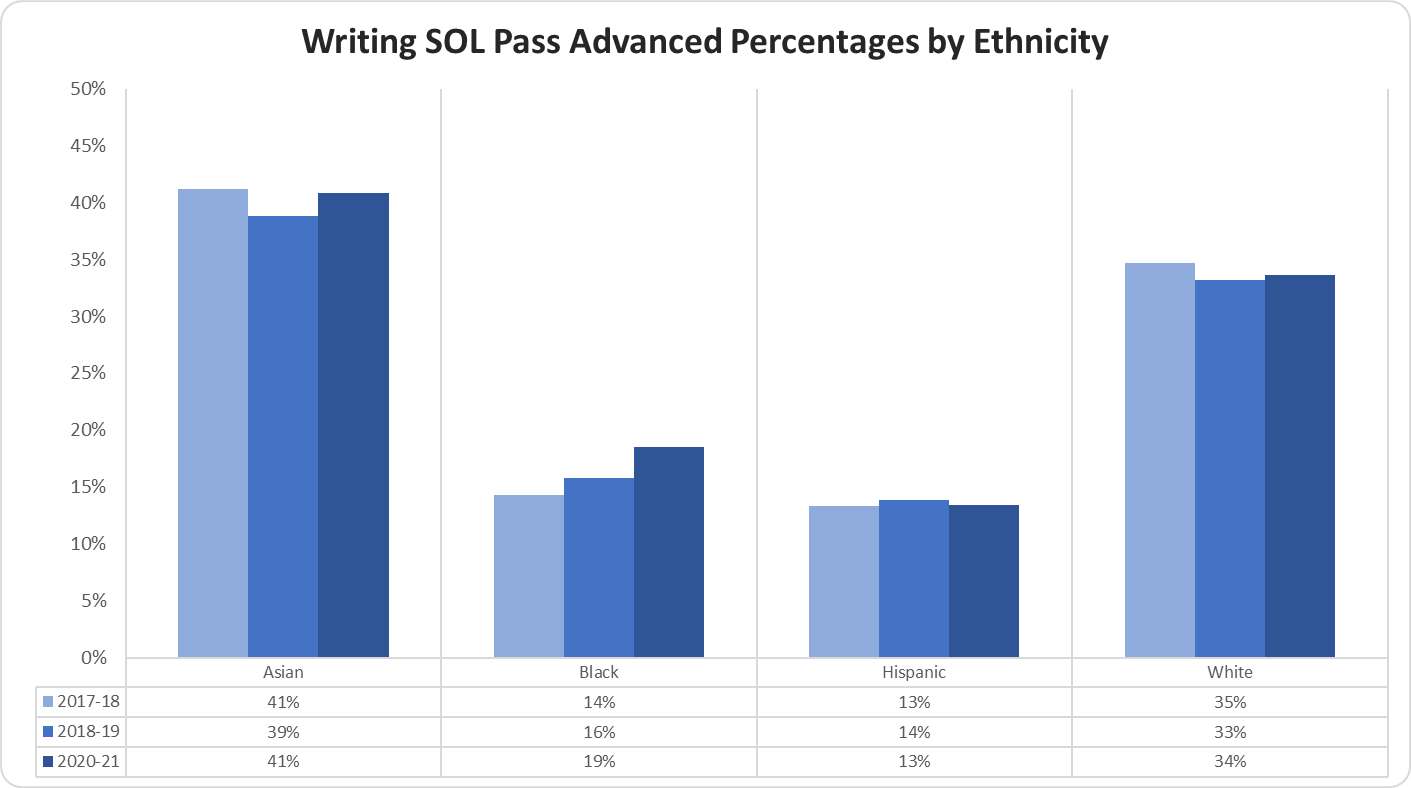
Writing SOL Pass Advanced Percentages by Student Group
The Writing SOL Pass Advanced Percentages by Student Group graph displays the percentage of students that passed the writing SOL at the advanced level for the most recent three years.
The percentage of Economically Disadvantaged students that earned a pass advanced score for the writing SOL in 2017-18 was 13%, 2018-19 was 13%, and 2020-21 was 13%; the Non-Economically Disadvantaged students that earned a pass advanced score for the writing SOL in 2017-18 was 32%, 2018-19 was 31%, and 2020-21 was 30%; the gap between the two groups in 2017-18 was 19%, 2018-19 was 18%, and 2020-21 was 17%.
The percentage of EL students that earned a pass advanced score for the writing SOL in 2017-18 was 2%, 2018-19 was 6%, and 2020-21 was 8%; the Non-EL students that earned a pass advanced score for the writing SOL in 2017-18 was 25%, 2018-19 was 25%, and 2020-21 was 28%; the gap between the two groups in 2017-18 was 23%, 2018-19 was 19%, and 2020-21 was 20%.
The percentage of Students with Disabilities that earned a pass advanced score for the writing SOL in 2017-18 was 9%, 2018-19 was 11%, and 2020-21 was 18%; the Students without Disabilities that earned a pass advanced score for the writing SOL in 2017-18 was 26%, 2018-19 was 25%, and 2020-21 was 26%; the gap between the two groups in 2017-18 was 17%, 2018-19 was 14%, and 2020-21 was 8%.
