Many of the metrics of school success relate to graduating seniors and their preparedness for life after high school. This page contains a variety of data related to high school students and their college and career readiness. First, there are a number of charts showing performance of graduating seniors on assessments. Performance on advanced exams (including Advanced Placement, International Baccalaureate, and Cambridge AICE exams) is shown annually and in five-year increments. Participation and performance of students on SAT and ACT tests is also included. Next, there are number of charts showing graduation performance, including On-Time Graduation Rates, Advanced Diplomas, and Dropout Rates. On-Time Graduation Rates are shown annually and in five-year increments. Finally, there are charts displaying the percentage of 12th grade students meeting college readiness benchmarks defined by the Virginia Community College System (VCCS).
Note: Information for All Students is colored in shades of purple on some of the charts to help distinguish between divisionwide data and outcomes of different ethnic groups.
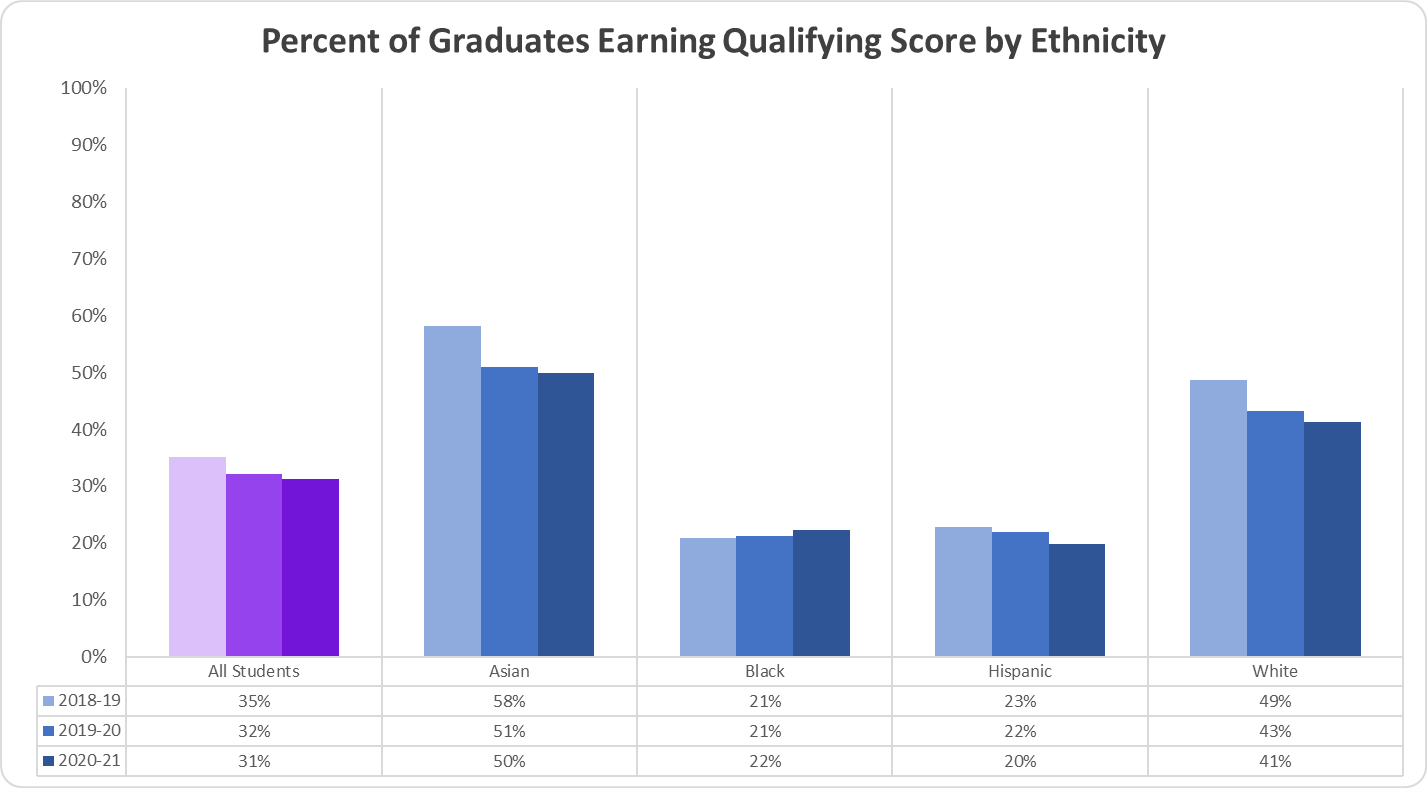
Percent of Graduates Earning a Qualifying Score by Ethnicity
The
Percent
of
Graduates
Earning
a
Qualifying
Score
by
Ethnicity
Graph
displays
the
percentage
of
students
that
earned
a
qualifying
score
on
an
Advanced
Placement,
Cambridge
AICE,
or
International
Baccalaureate
exam
for
the
most
recent
three
years.
The
percentage
of
All
students
that
earned
a
qualifying
score
in
2018-19
was
35%,
2019-20
was
32%,
and
2020-21
was
31%;
the
percentage
of
Asian
students
that
earned
a
qualifying
score
in
2018-19
was
58%,
2019-20
was
51%,
and
2020-21
was
50%;
the
percentage
of
Black
students
that
earned
a
qualifying
score
in
2018-19
was
21%,
2019-20
was
21%,
and
2020-21
was
22%;
the
percentage
of
Hispanic
students
that
earned
a
qualifying
score
in
2018-19
was
23%,
2019-20
was
22%,
and
2020-21
was
20%;
the
percentage
of
White
students
that
earned
a
qualifying
score
in
2018-19
was
49%,
2019-20
was
43%,
and
2020-21
was
41%.
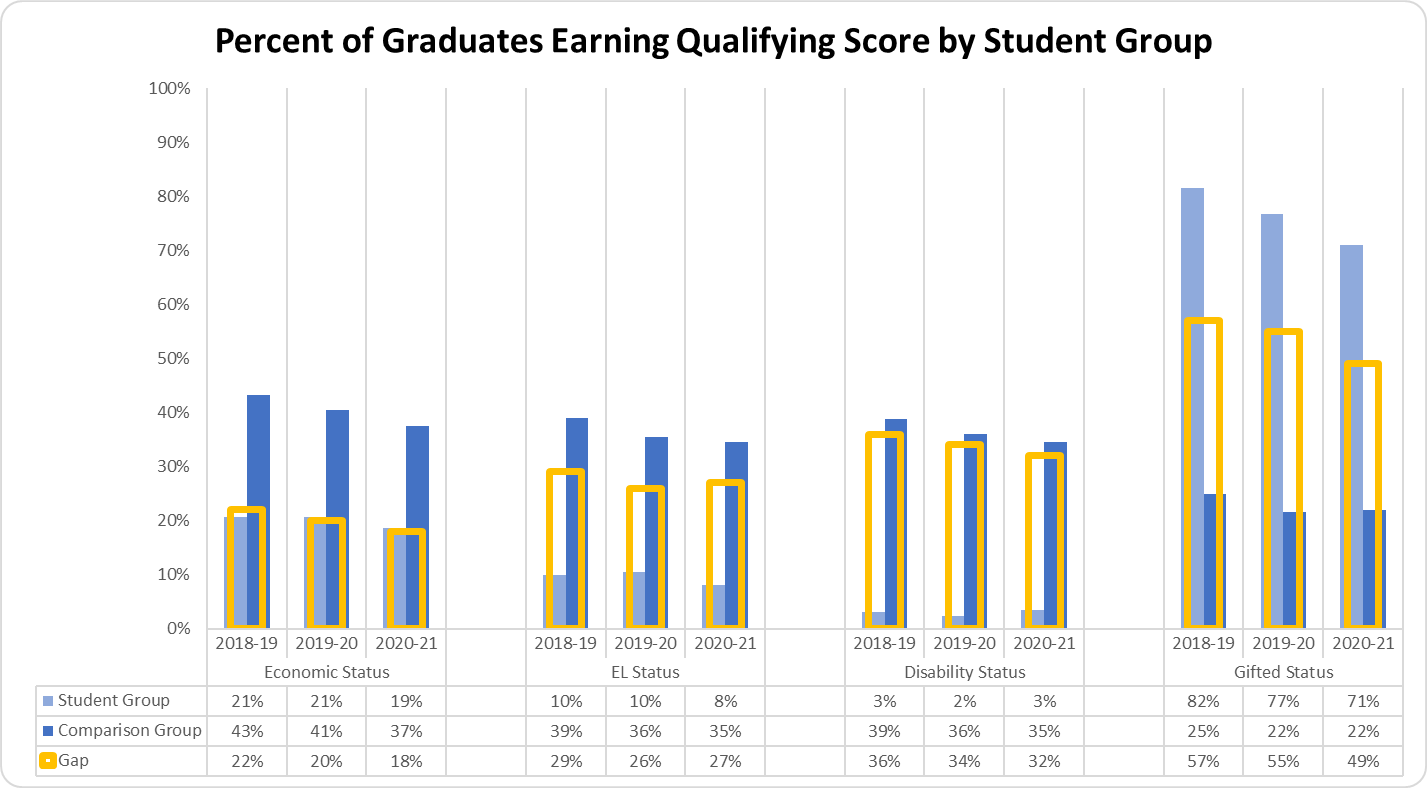
Percent of Graduates Earning Qualifying Score by Student Group
The
Percent
of
Graduates
Earning
Qualifying
Score
by
Student
Group
graph
displays
the
percentage
of
students
that
earned
a
qualifying
score
on
an
Advanced
Placement,
Cambridge
AICE,
or
International
Baccalaureate
exam
for
the
most
recent
three
years.
The
percentage
of
Economically
Disadvantaged
students
that
earned
a
qualifying
score
in
2018-19
was
21%,
2019-20
was
21%,
and
2020-21
was
19%;
the
Non-Economically
Disadvantaged
students
that
earned
a
qualifying
score
in
2018-19
was
43%,
2019-20
was
41%,
and
2020-21
was
37%;
the
gap
between
the
two
groups
in
2018-19
was
22%,
2019-20
was
20%
and
2020-21
was
18%.
The percentage of English Learner students that earned a qualifying score in 2018-19 was 10%, 2019-20 was 10%, and 2020-21 was 8%; the Non-English Learner students that earned a qualifying score in 2018-19 was 39%, 2019-20 was 36%, and 2020-21 was 35%; the gap between the two groups in 2018-19 was 29%, 2019-20 was 26% and 2020-21 was 27%.
The percentage of Students with Disabilities that earned a qualifying score in 2018-19 was 3%, 2019-20 was 2%, and 2020-21 was 3%; the Students without Disabilities that earned a qualifying score in 2018-19 was 39%, 2019-20 was 36%, and 2020-21 was 35%; the gap between the two groups in 2018-19 was 36%, 2019-20 was 34% and 2020-21 was 32%.
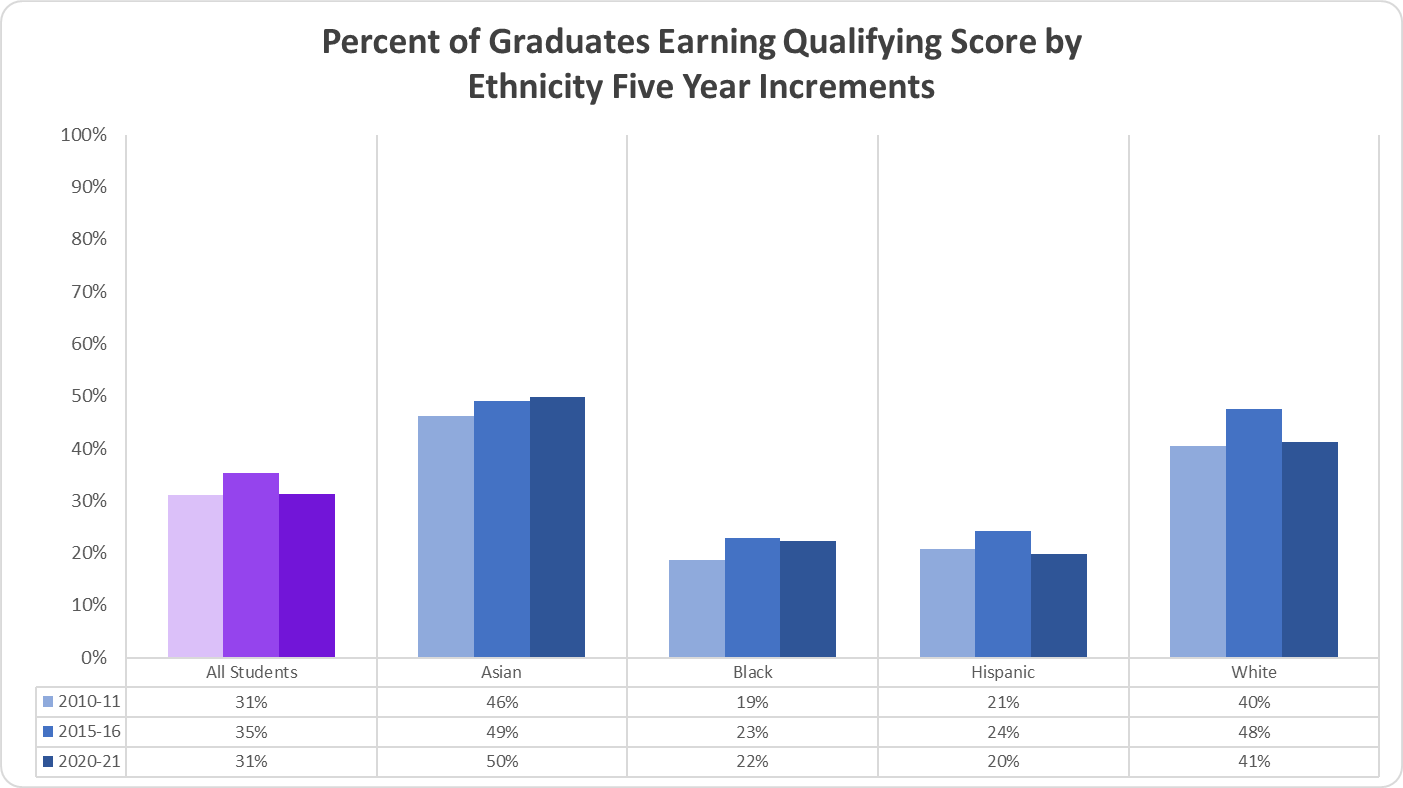
Percent of Graduates Earning a Qualifying Score by Ethnicity in Five Year Increments
The Percent of Graduates Earning a Qualifying Score by Ethnicity in Five-Year Increments graph displays the percentage of students that earned a qualifying score on an Advanced Placement, Cambridge AICE, or International Baccalaureate exam for the most recent five-year increments.
The percentage of All Students that earned a qualifying score in 2010-11 was 31%, 2015-16 was 35%, and 2020-21 was 31%; the percentage of Asian students that earned a qualifying score in 2010-11 was 46%, 2015-16 was 49%, and 2020-21 was 50%; the percentage of Black students that earned a qualifying score in 2010-11 was 19%, 2015-16 was 23%, and 2020-21 was 22%; the percentage of Hispanic students that earned a qualifying score in 2010-11 was 21%, 2015-16 was 24%, 2020-21 was 20%; the percentage of White students that earned a qualifying score in 2010-11 was 40%, 2015-16 was 48%, and 2020-21 was 41%.
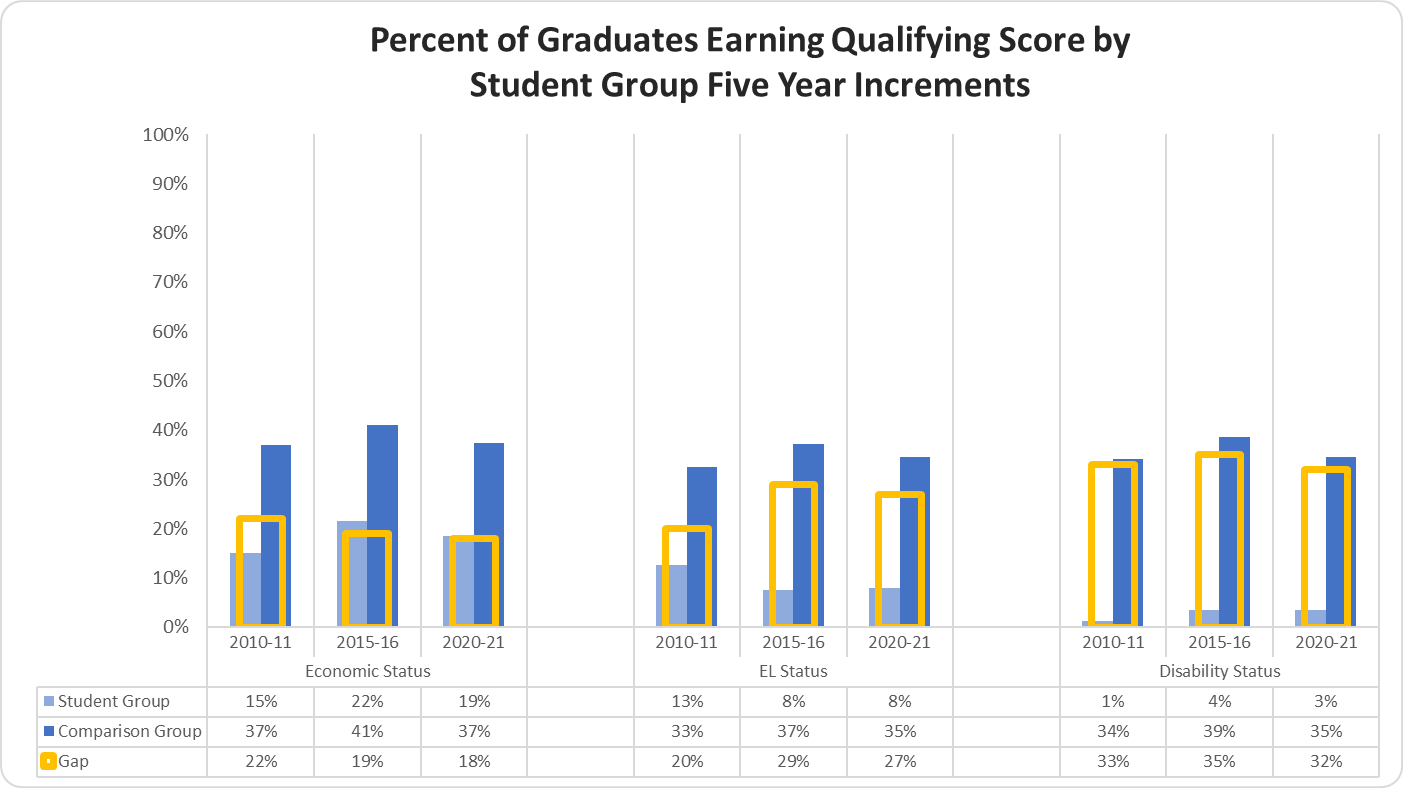
Percent of Graduates Earning a Qualifying Score by Student Group in Five Year Increments
The Percent of Graduates Earning a Qualifying Score by Student Group in Five-Year Increments graph displays the percentage of graduate students that earned a qualifying score for the most recent five-year increments.
The percentage of Economically Disadvantaged graduate students that earned a qualifying score in 2010-11 was 15%, 2015-16 was 22% and 2020-21 was 19%; the percentage of Non-Economically Disadvantaged students that earned a qualifying score in 2010-11 was 37%, 2015-16 was 41% and 2020-21 was 37%; the gap between the two groups in 2010-11 was 22%, 2015-16 was 19% and 2020-21 was 18%.
The percentage of EL graduate students that earned a qualifying score in 2010-11 was 13%, 2015-16 was 8% and 2020-21 was 8%; the percentage of Non-EL students that earned a qualifying score in 2010-11 was 33%, 2015-16 was 37% and 2020-21 was 35%; the gap between the two groups in 2010-11 was 20%, 2015-16 was 29% and 2020-21 was 27%.
The percentage of Students with Disabilities that earned a qualifying score in 2010-11 was 1%, 2015-16 was 4% and 2020-21 was 3%; the percentage of Students without Disabilities earned a qualifying score in 2010-11 was 34%, 2015-16 was 39% and 2020-21 was 35%; the gap between the two groups in 2010-11 was 33%, 2015-16 was 35% and 2020-21 was 32%.
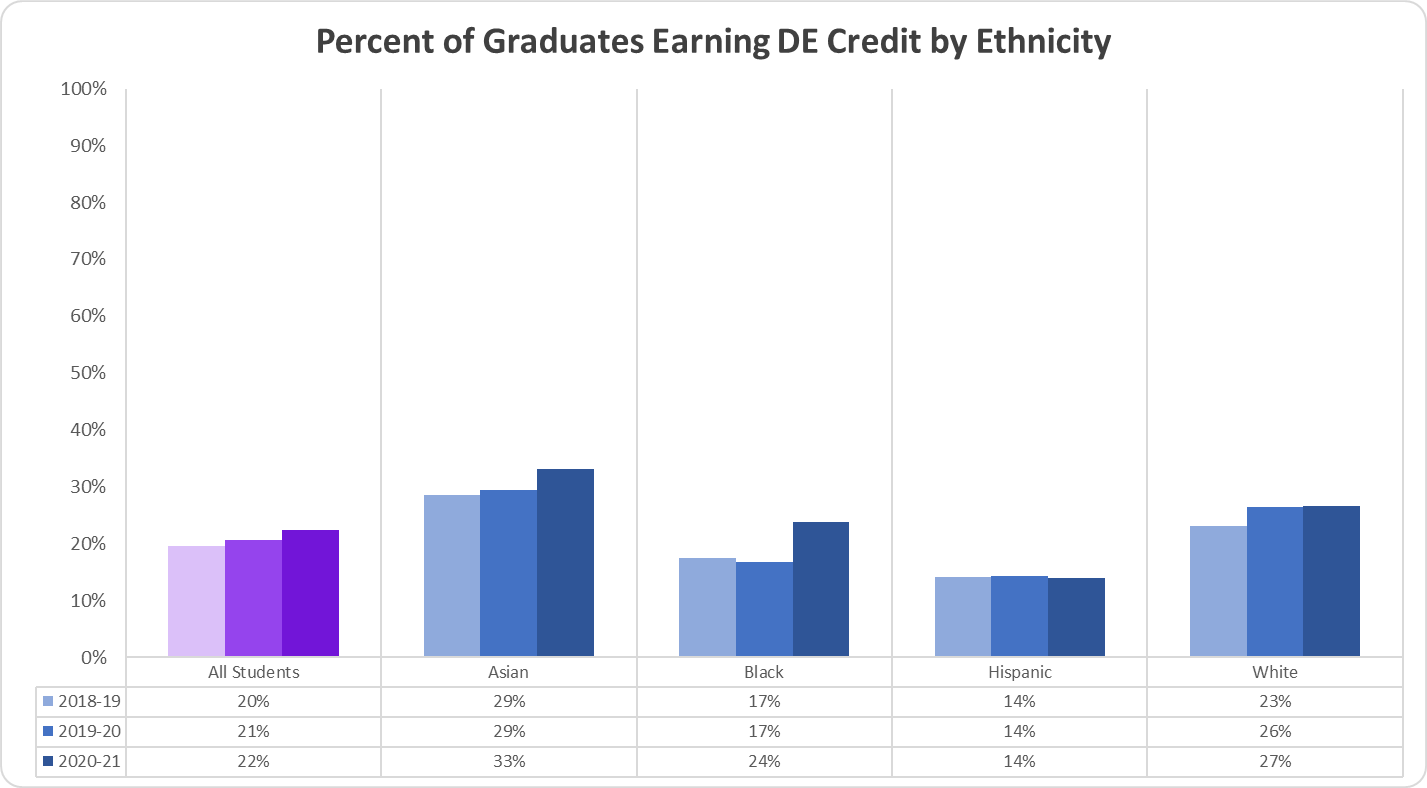
Percent of Graduates Earning a Dual Enrollment Credit by Ethnicity
The Percent of Graduates Earning a Dual Enrollment Credit by Ethnicity displays the percentage of students that earned a credit in a Dual Enrollment course for the most recent three years.
The percentage of All Students that earned a DE credit in 2018-19 was 20%, 2019-20 was 21%, and 2020-21 was 22%; the percentage of Asian students that earned a DE credit in 2018-19 was 29%, 2019-20 was 29%, and 2020-21 was 33%; the percentage of Black students that earned a DE credit in 2018-19 was 17%, 2019-20 was 17%, and 2020-21 was 24%; the percentage of Hispanic students that earned a DE credit in 2018-19 was 14%, 2019-20 was 14% and 2020-21 was 14%; the percentage of White students that earned a DE credit in 2018-19 was 23% 2019-20 was 26%, and 2020-21 was 27%.
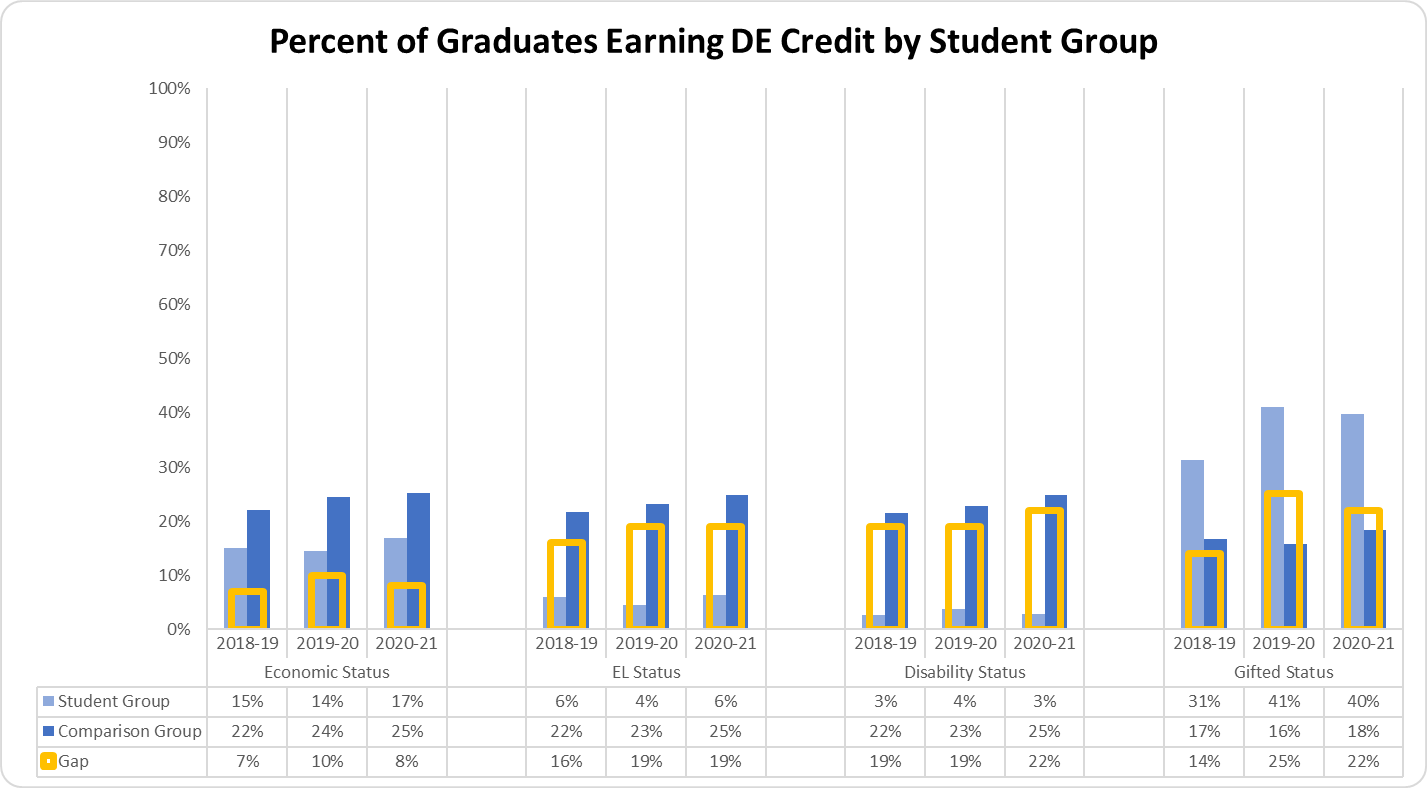
Percent of Graduates Earning a Dual Enrollment Credit by Student Group
The Percent of Graduates Earning a Dual Enrollment Credit by Student Group displays the percentage of students that earned a credit in a Dual Enrollment course for the most recent three years.
The percentage of Economically Disadvantaged students that earned a DE credit in 2018-19 was 15%, 2019-20 was 14%, and 2020-21 was 17%; the Non-Economically Disadvantaged students that earned a DE credit in 2018-19 was 22%, 2019-20 was 24%, and 2020-21 was 25%; the gap between the two groups in 2018-19 was 7%, 2019-20 was 10% and 2020-21 was 8%.
The percentage of English Learner students that earned a DE credit in 2018-19 was 6%, 2019-20 was 4%, and 2020-21 was 6%; the Non-English Learner students that earned a DE credit in 2018-19 was 22%, 2019-20 was 23%, and 2020-21 was 25%; the gap between the two groups in 2018-19 was 16%, 2019-20 was 19% and 2020-21 was 19%.
The percentage of Students with Disabilities that earned a DE credit in 2018-19 was 3%, 2019-20 was 4%, and 2020-21 was 3%; the Students without Disabilities that earned a DE credit in 2018-19 was 22%, 2019-20 was 23%, and 2020-21 was 25%; the gap between the two groups in 2018-19 was 19%, 2019-20 was 19% and 2020-21 was 22%.
The percentage of students identified as Gifted that earned a DE credit in 2018-19 was 31%, 2019-20 was 41%, and 2020-21 was 40%; the students not identified as Gifted that earned a DE credit in 2018-19 was 17%, 2019-20 was 16%, and 2020-21 was 18%; the gap between the two groups in 2018-19 was 14%, 2019-20 was 25% and 2020-21 was 22%.
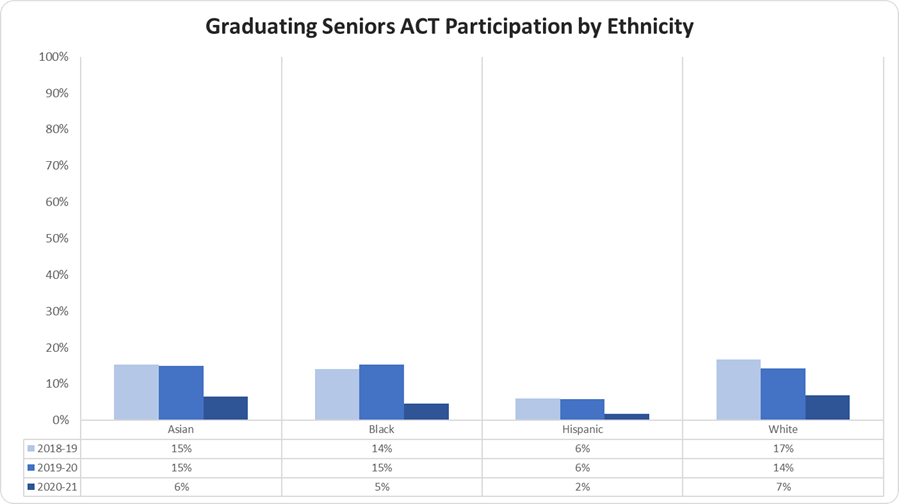
Percent of Graduating Seniors ACT Participation by Ethnicity
The Percent of Graduating Seniors ACT Participation by Ethnicity graph displays the percentage of graduating senior students that participated in taking the ACT (a standardized test used for college admissions in the United States) for the most recent three years.
The percentage of graduating senior Asian students that participated in taking the ACT in 2018-19 was 15%, 2019-20 was 15%, and 2020-21 was 6%; the percentage of graduating senior Black students that participated in taking the ACT in 2018-19 was 14%, 2019-20 was 15%, and 2020-21 was 5%; the percentage of graduating senior Hispanic students that participated in taking the ACT in 2018-19 was 6%, 2019-20 was 6%, and 2020-21 was 2%; the percentage of graduating senior White students that participated in taking the ACT in 2018-19 was 17%, 2019-20 was 14%. And 2020-21 was 7%.
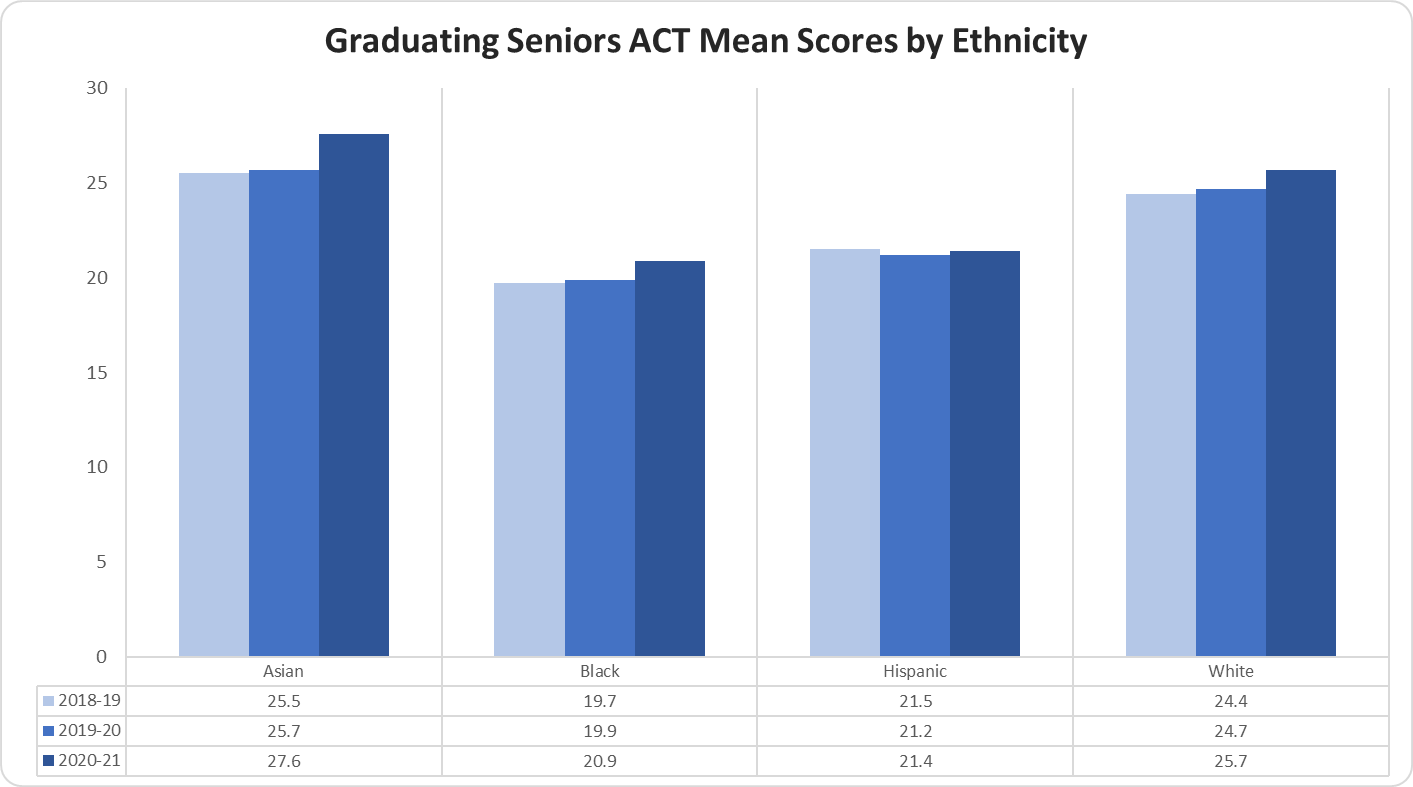
Graduating Seniors ACT Mean Scores by Ethnicity
The Graduating Seniors ACT Mean Scores by Ethnicity graph displays the mean scores for the ACT (a standardized test used for college admissions in the United States) for the most recent three years.
The mean score for graduating senior Asian students in 2018-19 was 25.5, 2019-20 was 25.7, and 2020-21 was 27.6; the mean score for graduating senior Black students in 2018-19 was 19.7, 2019-20 was 19.9, and 2020-21 was 20.9; the mean score for graduating senior Hispanic students in 2018-19 was 21.5, 2019-20 was 21.2, and 2020-21 was 21.4; the mean score for graduating senior White students in 2018-19 was 24.4, 2019-20 was 24.7, and 2020-21 was 25.7.
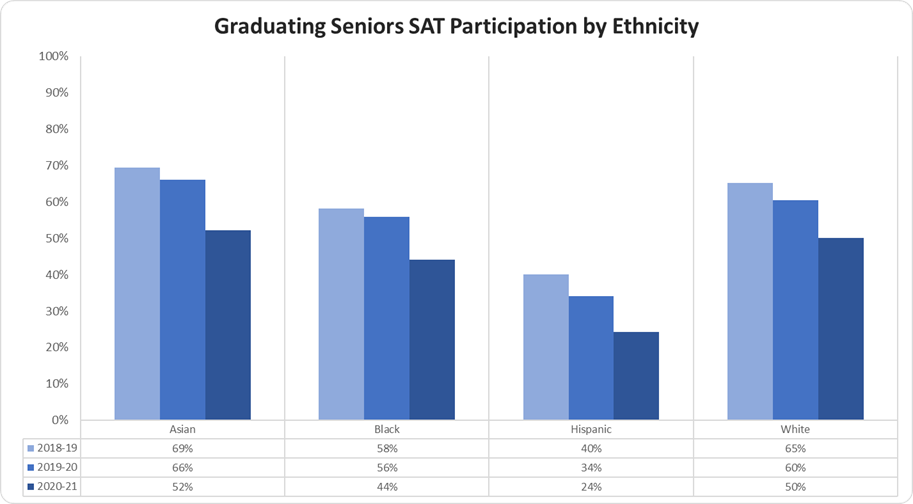
Percent of Graduating Seniors SAT Participation by Ethnicity
The Percent of Graduating Seniors SAT Participation by Ethnicity graph displays the percentage of students that participated in taking the SAT (a standardized test used for college admissions in the United States) for the most recent three years.
The percentage of graduating senior Asian students that participated in taking the SAT in 2018-19 was 69%, 2019-20 was 66%, and 2020-21 was 52%; the percentage of graduating senior Black students that participated in taking the SAT in 2018-19 was 58%, 2019-20 was 56%, and 2020-21 was 44%; the percentage of graduating senior Hispanic students that participated in taking the SAT in 2018-19 was 40%, 2019-20 was 34%, and 2020-21 was 24%; the percentage of graduating senior White students that participated in taking the SAT in 2018-19 was 65%, 2019-20 was 60%, and 2020-21 was 50%.
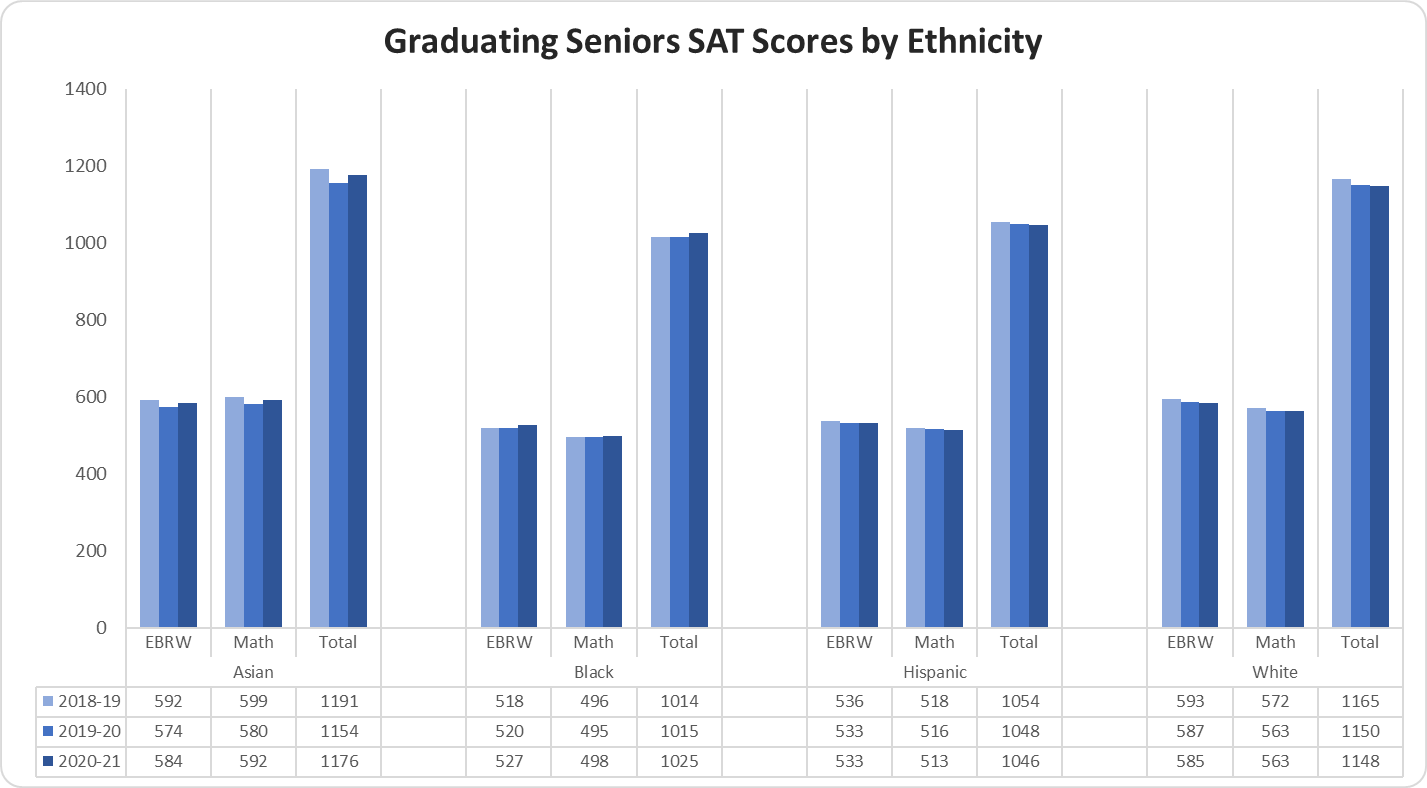
Graduating Seniors SAT Scores by Ethnicity
The Graduating Seniors SAT Scores by Ethnicity graph displays the average EBRW (Evidence-based Reading and Writing), Math and Total scores for the SAT (a standardized test used for college admissions in the United States) for the most recent three years.
The SAT average EBRW score for graduating senior Asian students in 2018-19 was 592, 2019-20 was 574, and 2020-21 was 584; the SAT average math score for graduating senior Asian students in 2018-19 was 599, 2019-20 was 580, and 2020-21 was 592; the SAT average total score for graduating senior Asian students in 2018-19 was 1191, 2019-20 was 1154, and 2020-21 was 1176
The SAT average EBRW score for graduating senior Black students in 2018-19 was 518, 2019-20 was 520, and 2020-21 was 527; the SAT average math score for graduating senior Black students in 2018-19 was 496, 2019-20 was 495, and 2020-21 was 498; the SAT average total score for graduating senior Black students in 2018-19 was 1014, 2019-20 was 1015, and 2020-21 was 1025.
The SAT average EBRW score for graduating senior Hispanic students in 2018-19 was 536, 2019-20 was 533, and 2020-21 was 533; the SAT average math score for graduating senior Hispanic students in 2018-19 was 518, 2019-20 was 516, and 2020-21 513; the SAT average total score for graduating senior Hispanic students in 2018-19 was 1054, 2019-20 was 1048, and 2020-21 was 1046.
The SAT average EBRW score for graduating senior White students in 2018-19 was 593, 2019-20 was 587, and 2020-21 was 585; the SAT average math score for graduating senior White students in 2018-19 was 572, 2019-20 was 563, and 2020-21 was 563; the SAT average total score for graduating senior White students in 2018-19 was 1165, 2019-20 was 1150, and 2020-21 was 1148.
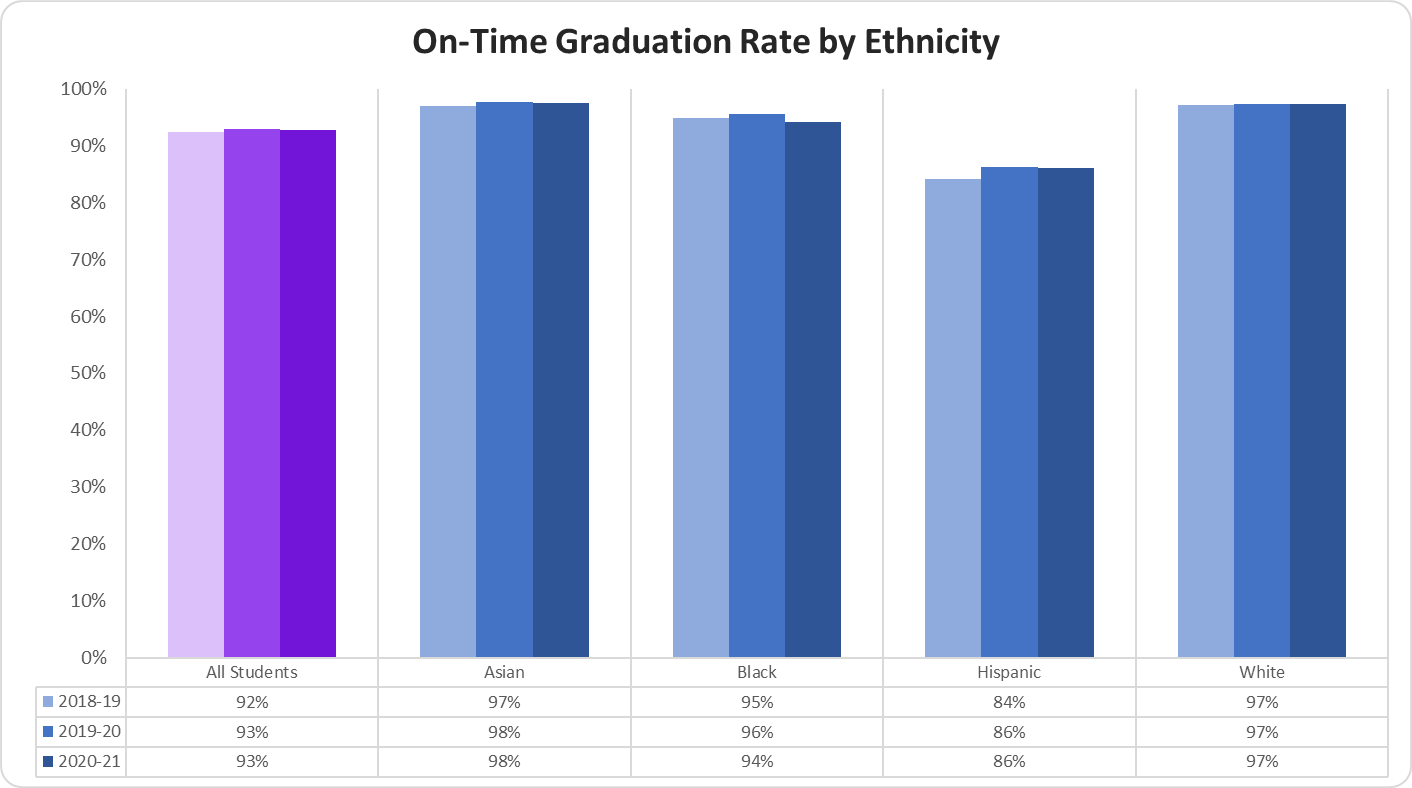
On-Time Graduation Rate by Ethnicity
The On-Time Graduation Rate by Ethnicity graph displays the percentage of students that graduated on-time for the most recent three years.
The percentage of All Students that graduated on time in 2018-19 was 92%, 2019-20 was 93%, and 2020-21 was 93%; the percentage of Asian students that graduated on-time in 2018-19 was 97%, 2019-20 was 98%, and 2020-21 was 98%; the percentage of Black students that graduated on-time in 2018-19 was 95%, 2019-20 was 96%, and 2020-21 was 94%; the percentage of Hispanic students that graduated on-time in 2018-19 was 84%, 2019-20 was 86%, and 2020-21 was 86%; the percentage of White students that graduated on-time in 2018-19 was 97%, 2019-20 was 97%, and 2020-21 was 97%.
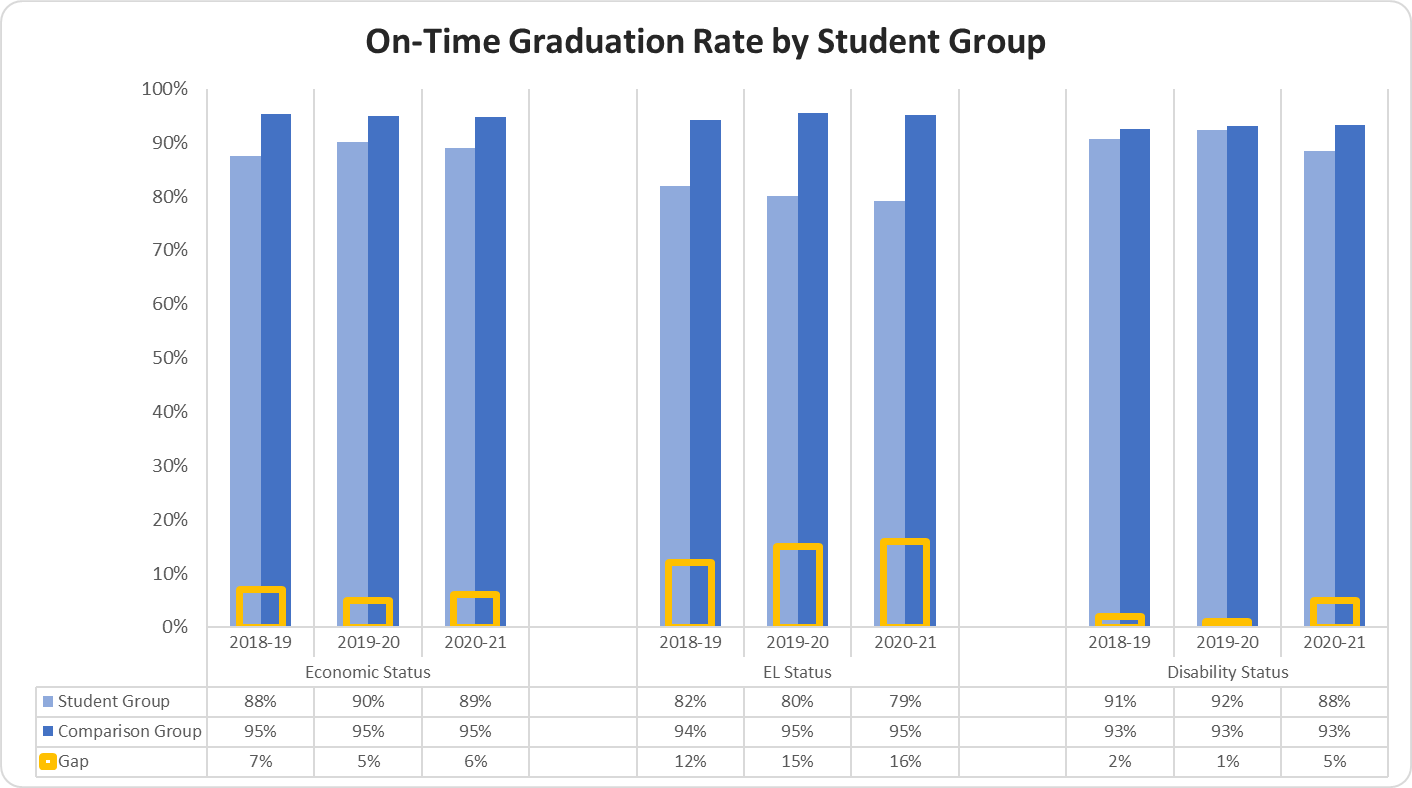
On-Time Graduation Rate by Student Group
The On-Time Graduation Rate by Student Group graph displays the percentage of students that graduated on-time for the most recent three years.
The percentage of Economically Disadvantaged students that graduated on-time in 2018-19 was 88%, 2019-20 was 90%, and 2020-21 was 89%; the percentage of Non-Economically Disadvantaged students that graduated on-time in 2018-19 was 95%, 2019-20 was 95%, and 2020-21 was 95%; the gap between the two groups in 2018-19 was 7%, 2019-20 was 5%, and 2020-21 was 6%.
The percentage of EL students that graduated on-time in 2018-19 was 82%, 2019-20 was 80%, and 2020-21 was 79%; the percentage of Non-EL students that graduated on-time in 2018-19 was 94%, 2019-20 was 95%, and 2020-21 was 95%; the gap between the two groups in 2018-19 was 12%, 2019-20 was 15%, and 2020-21 was 16%.
The percentage of Students with Disabilities that graduated on-time in 2018-19 was 91%, 2019-20 was 92%, and 2020-21 was 88%; the percentage of Students without Disabilities that graduated on-time in 2018-19 was 93%, 2019-20 was 93%, and 2020-21 was 93%; the gap between the two groups in 2018-19 was 2%, 2019-20 was 1%, and 2020-21 was 5%.
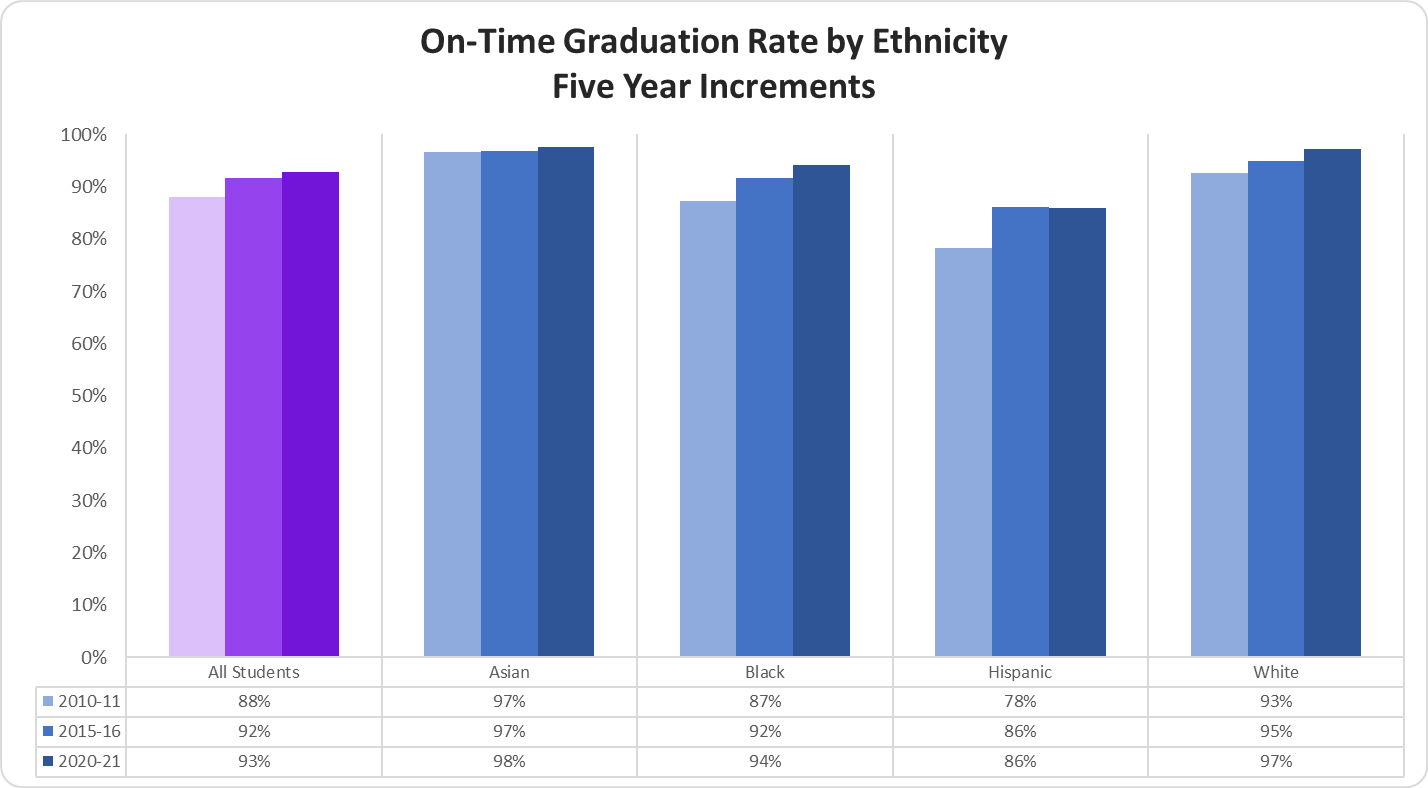
On-Time Graduation Rates by Ethnicity in Five Year Increments
The On-Time Graduation Rates by Ethnicity in Five-Year Increments graph displays the percentage of students that graduated on-time for the most recent five-year increments.
The percentage of All Students that graduated on time in 2010-11 was 88%, 2015-16 was 92%, and 2020-21 was 93%; the percentage of Asian students that graduated on-time in 2010-11 was 97%, 2015-16 was 97%, and 2020-21 was 98%; the percentage of Black students that graduated on-time in 2010-11 was 87%, 2015-16 was 92%, and 2020-21 was 94%; the percentage of Hispanic students that graduated on-time in 2010-11 was 78%, 2015-16 was 86%, and 2020-21 was 86%; the percentage of White students that graduated on-time in 2010-11 was 93%, 2015-16 was 95%, and 2020-21 was 97%.
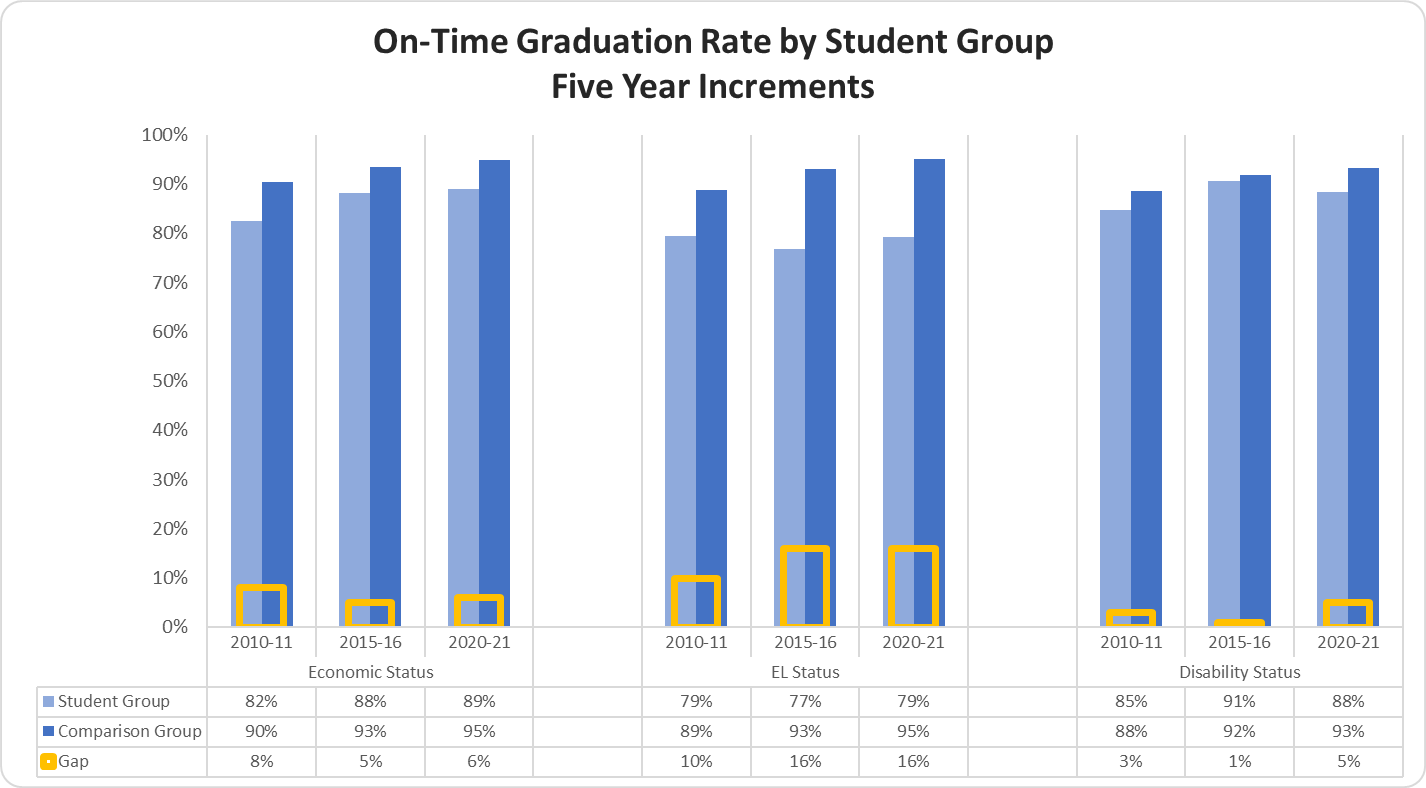
On-Time Graduation Rates by Student Group in Five Year Increments
The On-Time Graduation Rates by Student Group in Five-Year Increments graph displays the percentage of students that graduated on-time for the most recent five-year increments.
The percentage of Economically Disadvantaged students that graduated on-time in 2010-11 was 82%, 2015-16 was 88%, and 2020-21 was 89%; the percentage of Non-Economically Disadvantaged students that graduated on-time in 2010-11 was 90%, 2015-16 was 93%, and 2020-21 was 95%; the gap between the two groups in 2010-11 was 8%, 2015-16 was 5%, and 2020-21 was 6%.
The percentage of EL students that graduated on-time in 2010-11 was 79%, 2015-16 was 77%, 2020-21 was 79%; the percentage of Non-EL students that graduated on-time in 2010-11 was 89%, 2015-16 was 93%, and 2020-21 was 95%; the gap between the two groups in 2010-11 was 10%, 2015-16 was 16%, and 2020-21 was 16%.
The percentage of Students with Disabilities that graduated on-time in 2010-11 was 85%, 2015-16 was 91%, and 2020-21 was 88%; the percentage of Students without Disabilities that graduated on-time in 2010-11 was 88%, 2015-16 was 92%, and 2020-21 was 93%; the gap between the two groups in 2010-11 was 3%, 2015-16 was 1%, and 2020-21 is 5%.
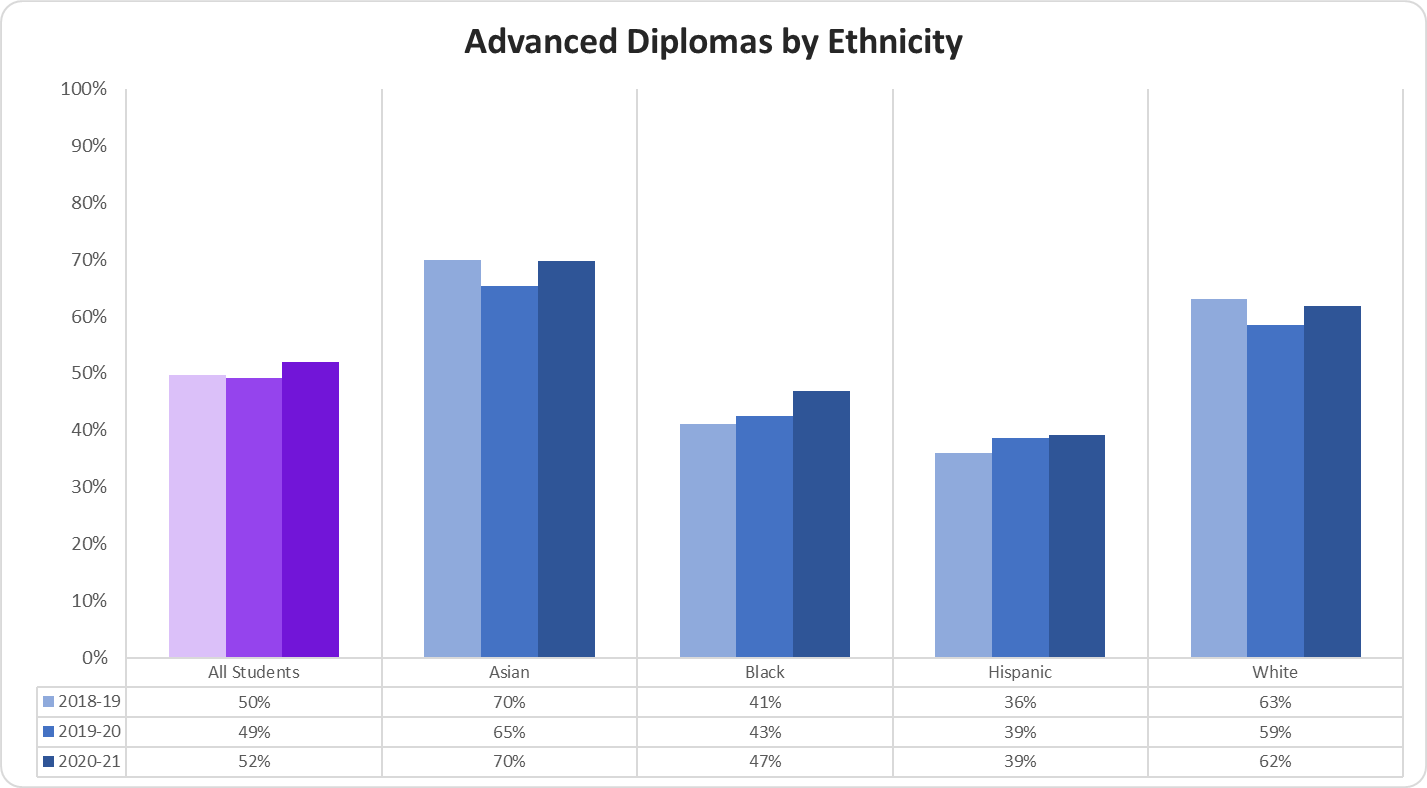
Percent of Advanced Diplomas by Ethnicity
The Percent of Advanced Diplomas by Ethnicity graph displays the percentage of students that earned an advanced diploma for the most recent three years.
The percentage of All Students that earned an advanced diploma in 2018-19 was 50%, 2019-20 was 49%, and 2020-21 was 52%; the percentage of Asian students that earned an advanced diploma in 2018-19 was 70%, 2019-20 was 65%, and 2020-21 was 70%; the percentage of Black students that earned an advanced diploma in 2018-19 was 41%, 2019-20 was 43%, and 2020-21 was 47%; the percentage of Hispanic students that earned an advanced diploma in 2018-19 was 36%, 2019-20 was 39%, and 2020-21 was 39%; the percentage of White students that earned an advanced diploma in 2018-19 was 63%, 2019-20 was 59%, and 2020-1 was 62%.
Percent of Advanced Diplomas by Student Group
The Percent of Advanced Diplomas by Student Group graph displays the percentage of students that earned an advanced diploma for the most recent three years.
The percentage of Economically Disadvantaged students that earned an advanced diploma in 2018-19 was 34%, 2019-20 was 35%, and 2020-21 was 37%; the Non-Economically Disadvantaged students that earned an advanced diploma in 2018-19 was 59%, 2019-20 was 58%, and 2020-21 was 59%; the gap between the two groups in 2018-19 was 26%, 2019-20 was 23% and 2020-21 was 22%.
The percentage of English Learner students that earned an advanced diploma in 2018-19 was 17%, 2019-20 was 16%, and 2020-21 was 18%; the Non-English Learner students that earned an advanced diploma in 2018-19 was 55%, 2019-20 was 54%, and 2020-21 was 57%; the gap between the two groups in 2018-19 was 38%, 2019-20 was 38% and 2020-21 was 39%.
The percentage of Students with Disabilities that earned an advanced diploma in 2018-19 was 7%, 2019-20 was 7%, and 2020-21 was 8%; the Students without Disabilities that earned an advanced diploma in 2018-19 was 55%, 2019-20 was 55%, and 2020-21 was 57%; the gap between the two groups in 2018-19 was 48%, 2019-20 was 47% and 2020-21 was 49%.
The percentage of students identified as Gifted that earned an advanced diploma in 2018-19 was 85%, 2019-20 was 86%, and 2020-21 was 86%; the students not identified as Gifted that earned an advanced diploma in 2018-19 was 41%, 2019-20 was 39%, and 2020-21 was 44%; the gap between the two groups in 2018-19 was 44%, 2019-20 was 47% and 2020-21 was 42%.
Percent of Drop-Out Rate by Ethnicity
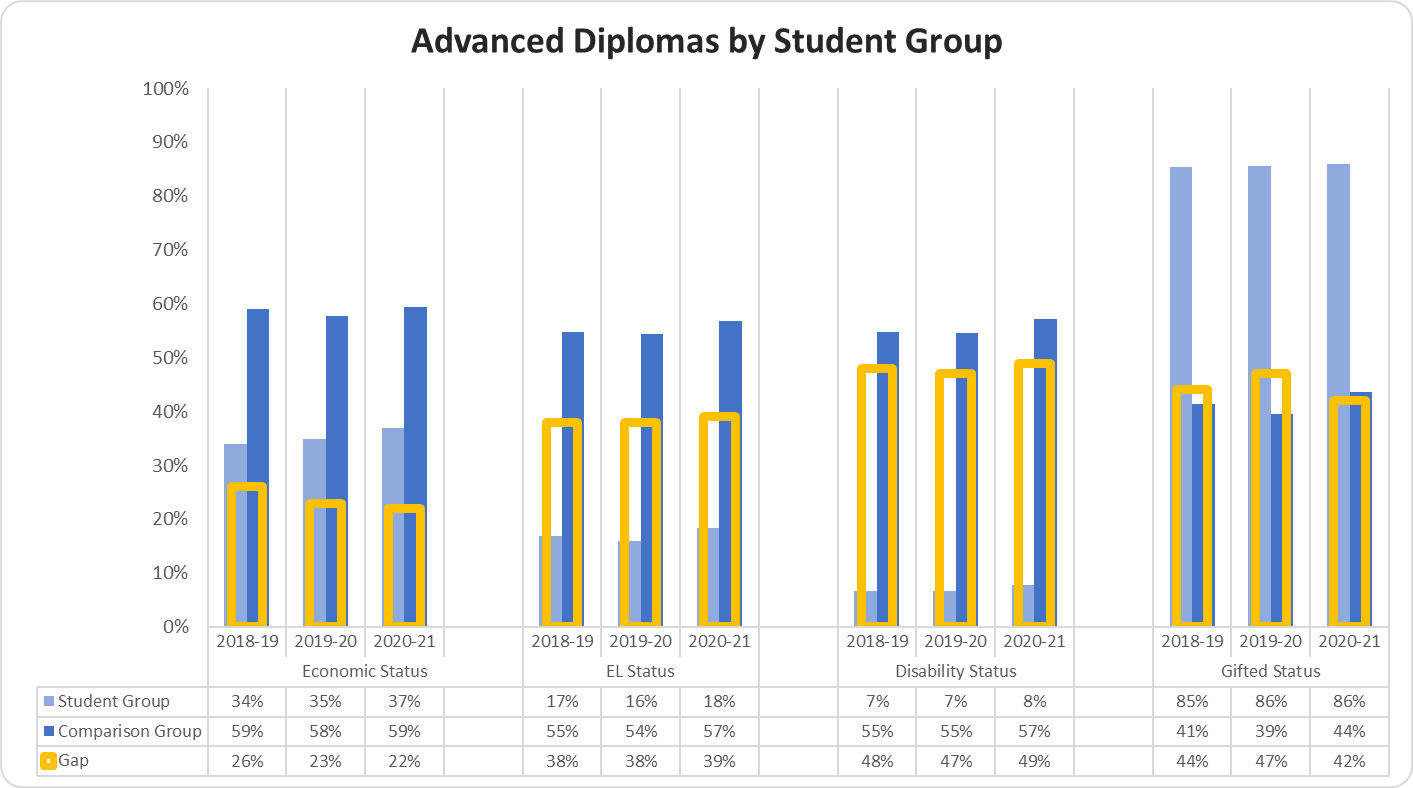
The Drop-Out Rate by Ethnicity graph displays the percentage of students that dropped out for the most recent three years.
The percentage of All Students that dropped out in 2018-19 was 6%, 2019-20 was 5%, and 2020-21 was 5%, the percentage of Asian students that dropped out in 2018-19 was 2%, 2019-20 was 1%, and 2020-21 was 2%; the percentage of Black students that dropped out in 2018-19 was 3%, 2019-20 was 2%, and 2020-21 was 3%; the percentage of Hispanic students that dropped out in 2018-19 was 13%, 2019-20 was 11%, and 2020-21 was 11%; the percentage of White students that dropped out in 2018-19 was 2%, 2019-20 was 1%, and 2020-21 was 1%.
Percent of Drop-Out Rate by Student Group
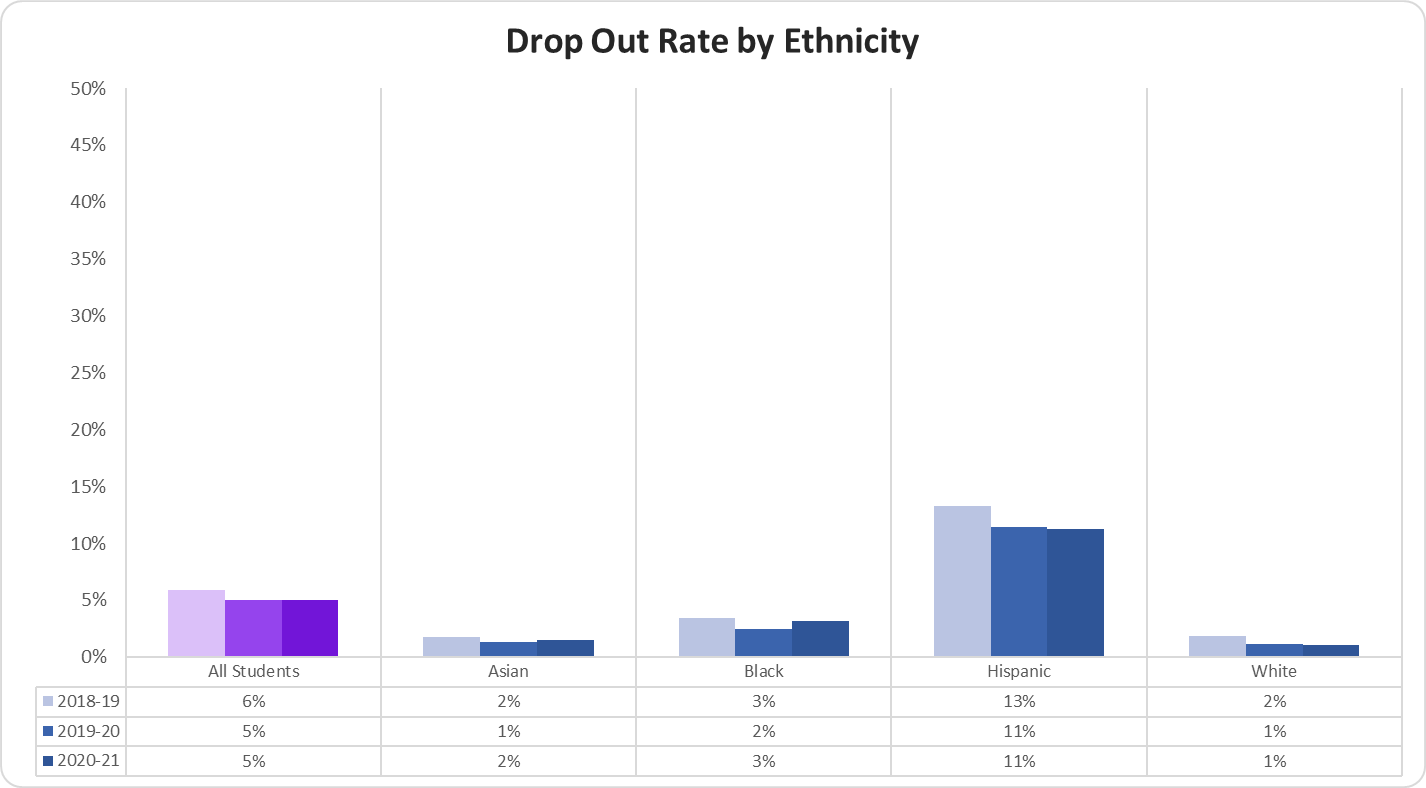
The Drop-Out Rate by Student Group graph displays the percentage of students that dropped out for the most recent three years.
The percentage of Economically Disadvantaged students that dropped out in 2018-19 was 10%, 2019-20 was 7%, and 2020-21 was 8%; the Non-Economically Disadvantaged students that dropped out in 2018-19 was 4%, 2019-20 was 4%, and 2020-21 was 4%; the gap between the two groups in 2018-19 was 6%, 2019-20 was 3% and 2020-21 was 4%.
The percentage of English Learner students that dropped out in 2018-19 was 18%, 2019-20 was 19%, and 2020-21 was 21%; the Non-English Learner students that dropped out in 2018-19 was 4%, 2019-20 was 1%, and 2020-21 was 2%; the gap between the two groups in 2018-19 was 14%, 2019-20 was 18% and 2020-21 was 19%.
The percentage of Students with Disabilities that dropped out in 2018-19 was 8%, 2019-20 was 6%, and 2020-21 was 11%; the Students without Disabilities that dropped out in 2018-19 was 6%, 2019-20 was 5%, and 2020-21 was 4%; the gap between the two groups in 2018-19 was 2%, 2019-20 was 1% and 2020-21 was 7%.
Percent of 12th Graders College Ready by VCCS Criteria by Ethnicity
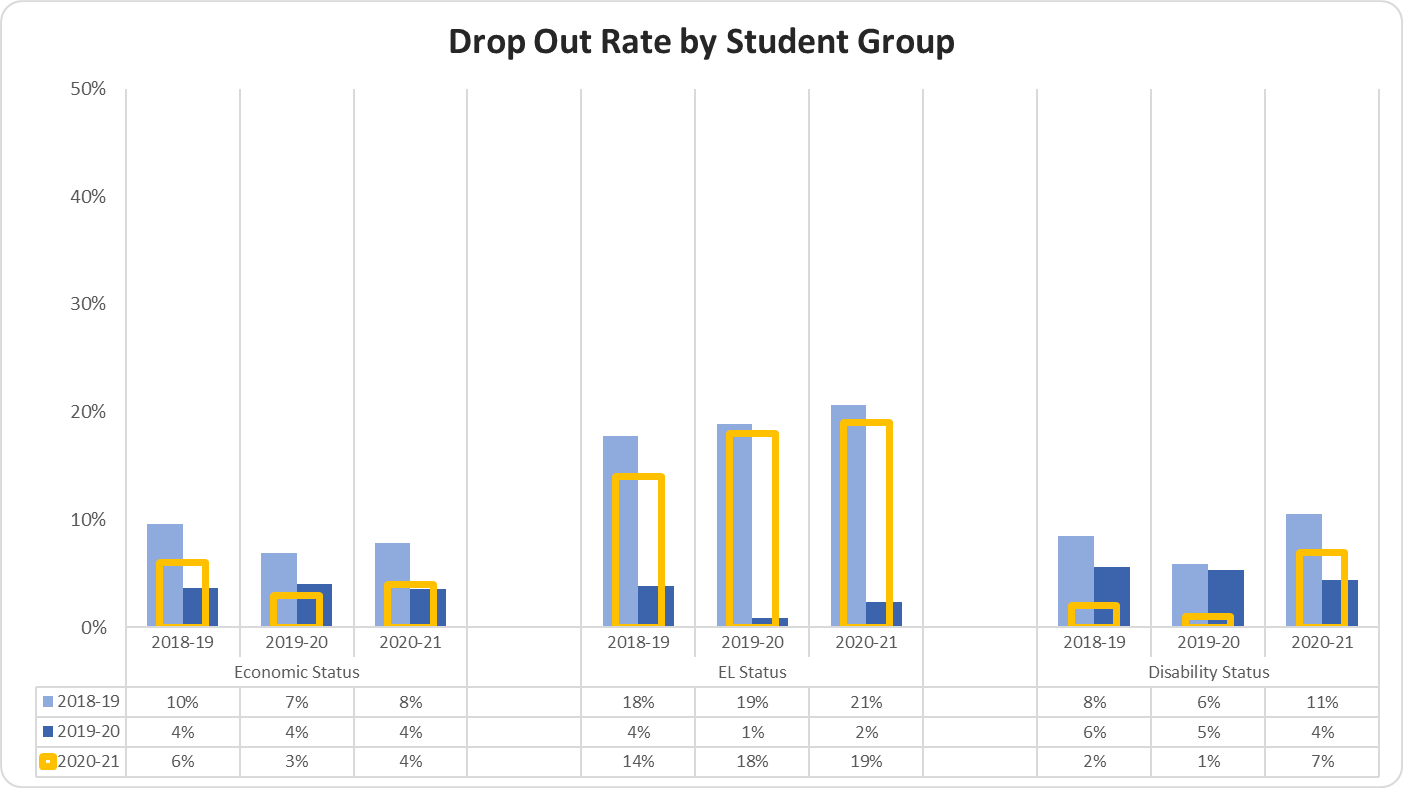
The Percent of 12th Graders College Ready by VCCS Criteria by Ethnicity graphs display the percentage of 12th graders meeting the VCCS college readiness criteria.
The percentage of All 12th grade students meeting the VCCS college readiness criteria in 2018-19 was 75%, 2019-20 was 72%, and 2020-21 was 70%; the percentage of Asian 12th grade students meeting the VCCS college readiness criteria in 2018-19 was 85%, 2019-20 was 84%, and 2020-21 was 81%; the percentage of Black 12th grade students meeting the VCCS college readiness criteria in 2018-19 was 72%, 2019-20 was 67%, and 2020-21 was 66%; the percentage of Hispanic 12th grade students meeting the VCCS college readiness criteria in 2018-19 was 60%, 2019-20 was 57%, and 2020-21 was 56%; the percentage of White 12th grade students meeting the VCCS college readiness criteria in 2018-19 was 87%, 2019-20 was 86%, and 2020-21 was 84%.
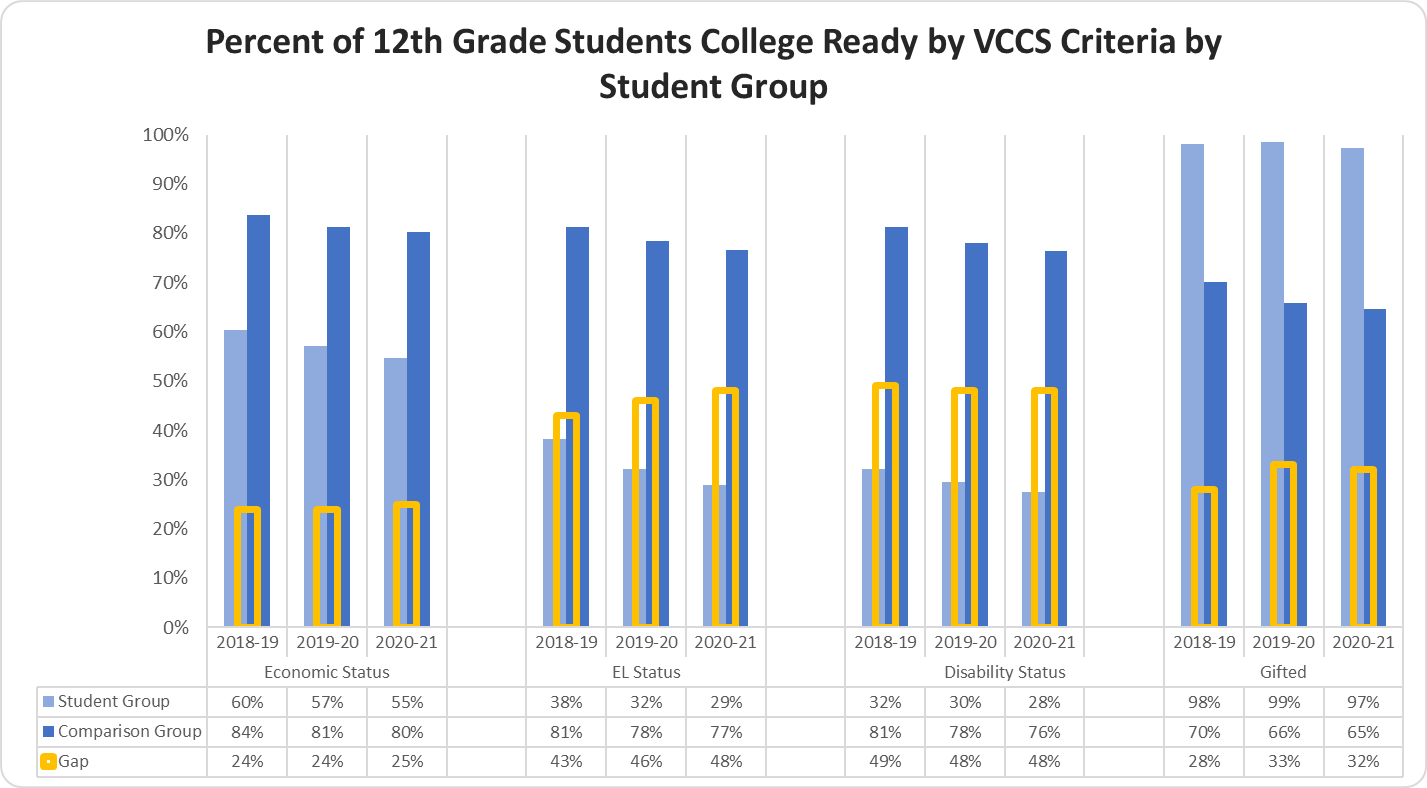
Percent of 12th Graders College Ready by VCCS Criteria by Student Group
The Percent of 12th Graders College Ready by VCCS Criteria by Ethnicity graphs display the percentage of 12th graders meeting the VCCS college readiness criteria.
The percentage of Economically Disadvantaged 12th grade students meeting the VCCS college readiness criteria in 2018-19 was 60%, 2019-20 was 57%, and 2020-21 was 55%; the percentage of Non-Economically Disadvantaged 12th grade students meeting the VCCS college readiness criteria in 2018-19 was 84%, 2019-20 was 81%, and 2020-21 was 80%; the gap between the two groups in 2018-19 was 24%, 2019-20 was 24%, and 2020-21 was 25%.
The percentage of EL 12th grade students meeting the VCCS college readiness criteria in 2018-19 was 38%, 2019-20 was 32%, and 2020-21 was 29%; the percentage of Non-EL 12th grade students meeting the VCCS college readiness criteria in 2018-29 was 81%, 2019-20 was 78%, and 2020-21 was 77%; the gap between the two groups in 2018-19 was 43%, 2019-20 was 46%, and 2020-21 was 48%.
The percentage of 12th grade Students with Disabilities meeting the VCCS college readiness criteria in 2018-19 was 32%, 2019-20 was 30%, and 2020-21 was 28%; the percentage of 12th grade Students without Disabilities meeting the VCCS college readiness criteria in 2018-19 was 81%, 2019-20 was 78%, and 2020-21 was 76%; the gap between the two groups in 2018-19 was 49%, 2019-20 was 48%, and 2020-21 was 48%.
The percentage of 12th grade students identified as gifted that are meeting the VCCS college readiness criteria in 2018-19 was 98%, 2019-20 was 99%, and 2020-21 was 97%; the percentage of 12th grade students not identified as gifted that are meeting the VCCS college readiness criteria in 2018-19 was 70%, 2019-20 was 66%, and 2020-21 was 65%; the gap between the two groups in 2018-19 was 28%, 2019-20 was 33%, and 2020-21 was 32%.
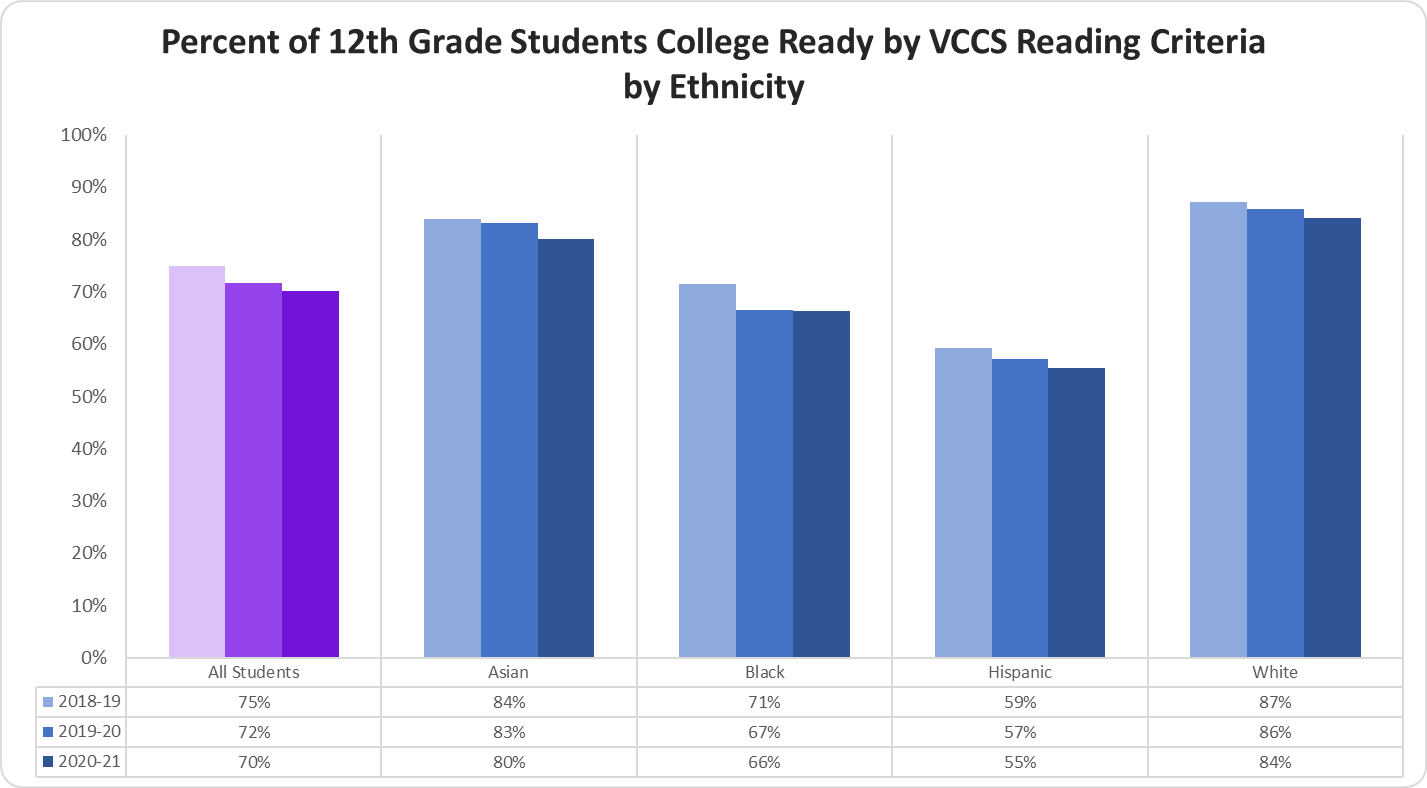
Percent of 12th Graders College Ready by VCCS Reading Criteria by Ethnicity
The Percent of 12th Graders College Ready by VCCS Reading Criteria by Ethnicity graphs display the percentage of 12th graders meeting the VCCS college readiness criteria for Reading.
The percentage of all 12th grade students meeting the VCCS college readiness criteria for reading in 2018-19 was 75%, 2019-20 was 72%, and 2020-21 was 70%; the percentage of Asian 12th grade students meeting the VCCS college readiness criteria for reading in 2018-19 was 84%, 2019-20 was 83%, and 2020-21 was 80%; the percentage of Black 12th grade students meeting the VCCS college readiness criteria for reading in 2018-19 was 71%, 2019-20 was 67%, and 2020-21 was 66%; the percentage of Hispanic 12th grade students meeting the VCCS college readiness criteria for reading in 2018-19 was 59%, 2019-20 was 57%, and 2020-21 was 55%; the percentage of White 12th grade students meeting the VCCS college readiness criteria for reading in 2018-19 was 87%, 2019-20 was 86%, and 2020-21 was 84%.
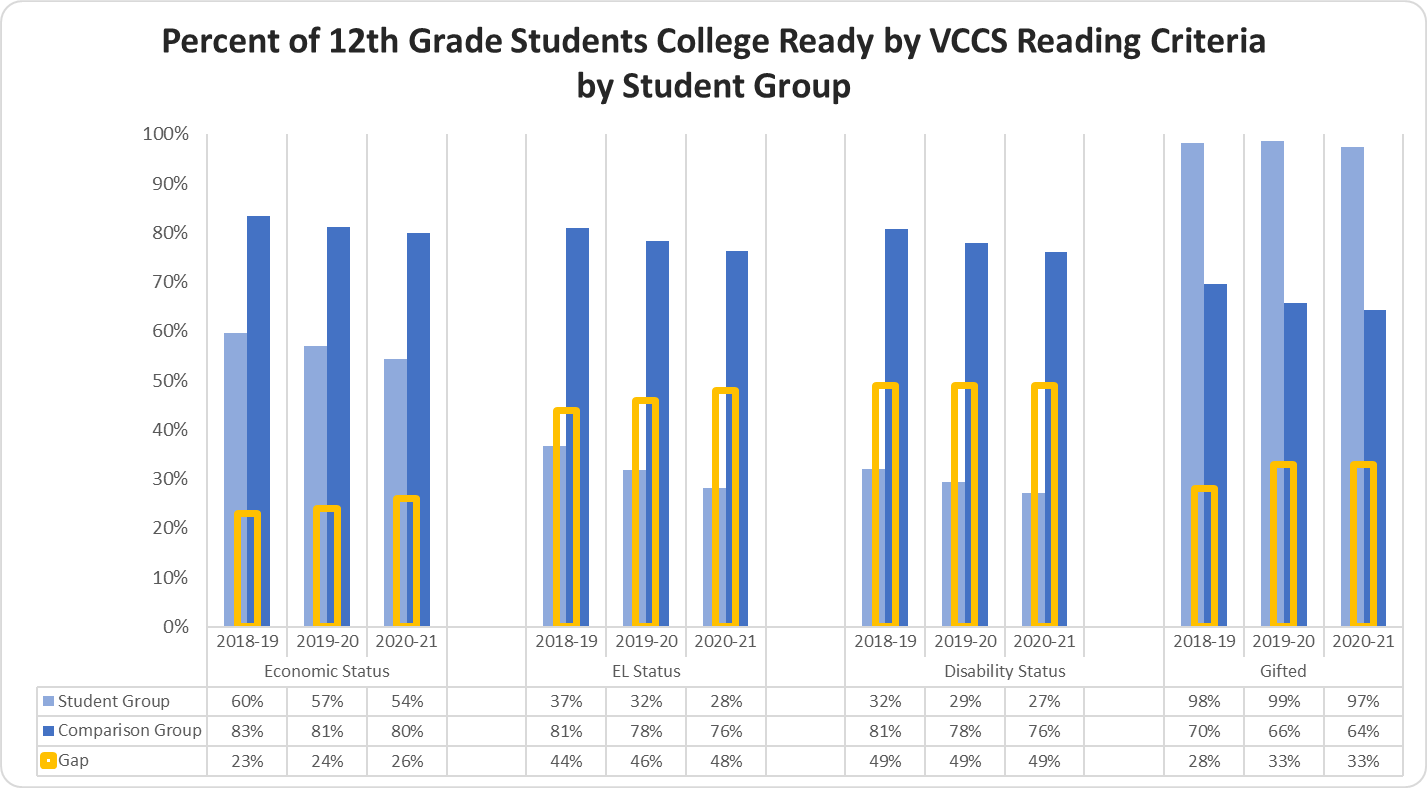
Percent of 12th Graders College Ready by VCCS Reading Criteria by Student Group
The Percent of 12th Graders College Ready by VCCS Reading Criteria by Student Group graphs display the percentage of 12th graders meeting the VCCS college readiness criteria for Reading.
The percentage of Economically Disadvantaged 12th grade students meeting the VCCS college readiness criteria for reading in 2018-19 was 60%, 2019-20 was 57%, and 2020-21 was 54%; the percentage of Non-Economically Disadvantaged 12th grade students meeting the VCCS college readiness criteria for reading in 2018-19 was 83%, 2019-20 was 81%, and 2020-21 was 80%; the gap between the two groups in 2018-19 was 23%, 2019-20 was 24%, and 2020-21 was 26%.
The percentage of EL 12th grade students meeting the VCCS college readiness criteria for reading in 2018-19 was 37%, 2019-20 was 32%, and 2020-21 was 28%; the percentage of Non-EL 12th grade students meeting the VCCS college readiness criteria for reading in 2018-19 was 81%, 2019-20 was 78%, and 2020-21 was 76%; the gap between the two groups in 2018-19 was 44%, 2019-20 was 46%, and 2020-21 was 48%.
The percentage of 12th grade Students with Disabilities meeting the VCCS college readiness criteria for reading in 2018-19 was 32%, 2019-20 was 29%, and 2020-21 was 27%; the percentage of 12th grade Students without Disabilities meeting the VCCS college readiness criteria for reading in 2018-19 was 81%, 2019-20 was 78%, and 2020-21 was 76%; the gap between the two groups in 2018-19 was 49%, 2019-20 was 49%, and 2020-21 was 49%.
The percentage of 12th grade students identified as gifted that were meeting the VCCS college readiness criteria for reading in 2018-19 was 98%, 2019-20 was 99%, and 2020-21 was 97%; the percentage of 12th grade students not identified as gifted that were meeting the VCCS college readiness criteria for reading in 2018-19 was 70%, 2019-20 was 66%, and 2020-21 was 64%; the gap between the two groups in 2018-19 was 28%, 2019-20 was 33%, and 2020-21 was 33%.
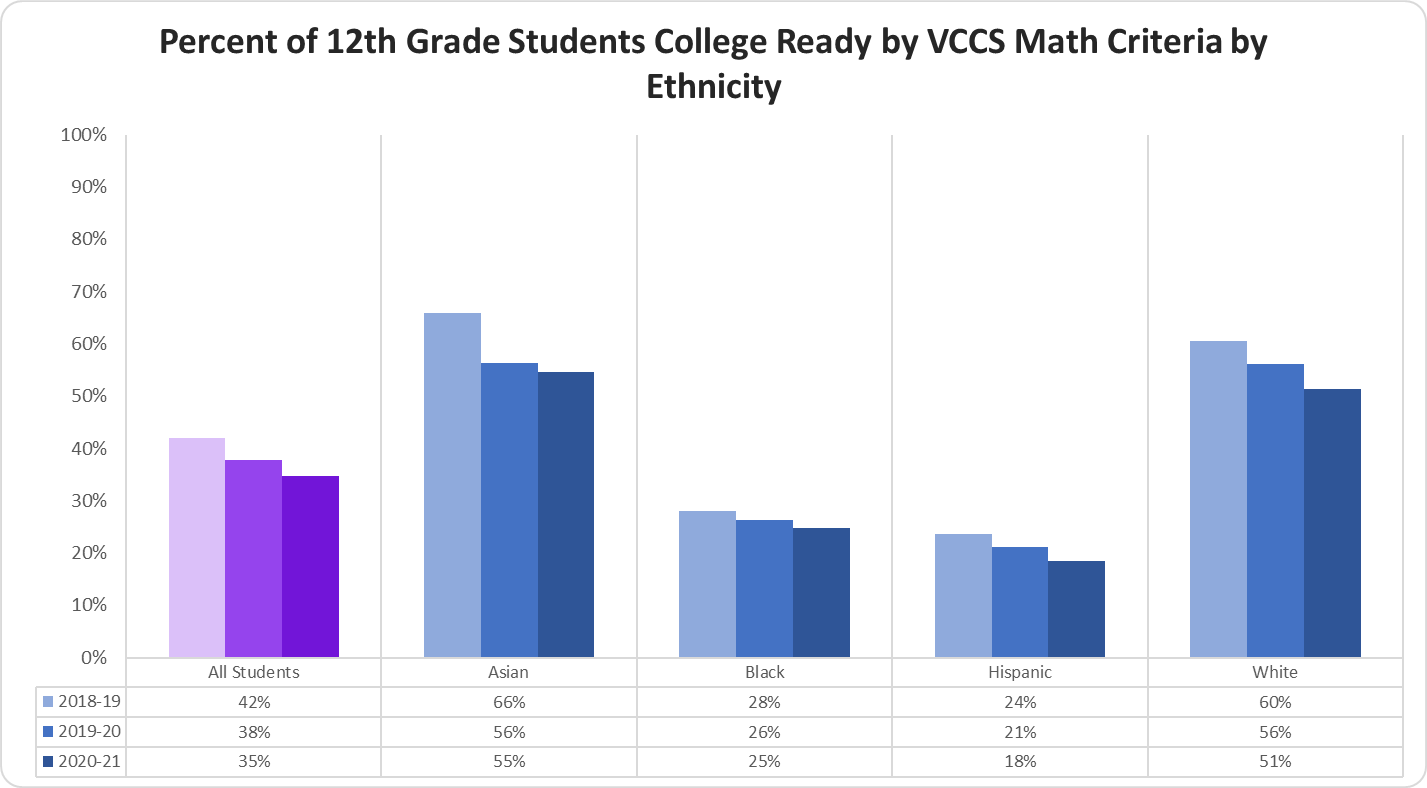
Percent of 12th Graders College Ready by VCCS Math Criteria by Ethnicity
The Percent of 12th Graders College Ready by VCCS Math Criteria by Ethnicity graphs display the percentage of 12th graders meeting the VCCS college readiness criteria for Math.
The percentage of All 12th grade students meeting the VCCS college readiness criteria for math in 2018-19 was 42%, 2019-20 was 38%, and 2020-21 was 35%; the percentage of Asian 12th grade students meeting the VCCS college readiness criteria for math in 2018-19 was 66%, 2019-20 was 56%, and 2020-21 was 55%; the percentage of Black 12th grade students meeting the VCCS college readiness criteria for math in 2018-19 was 28%, 2019-20 was 26%, and 2020-21 was 25%; the percentage of Hispanic 12th grade students meeting the VCCS college readiness criteria for math in 2018-19 was 24%, 2019-20 was 21%, and 2020-21 was 18%; the percentage of White 12th grade students meeting the VCCS college readiness criteria for math in 2018-19 was 60%, 2019-20 was 56%, and 2020-21 was 51%.
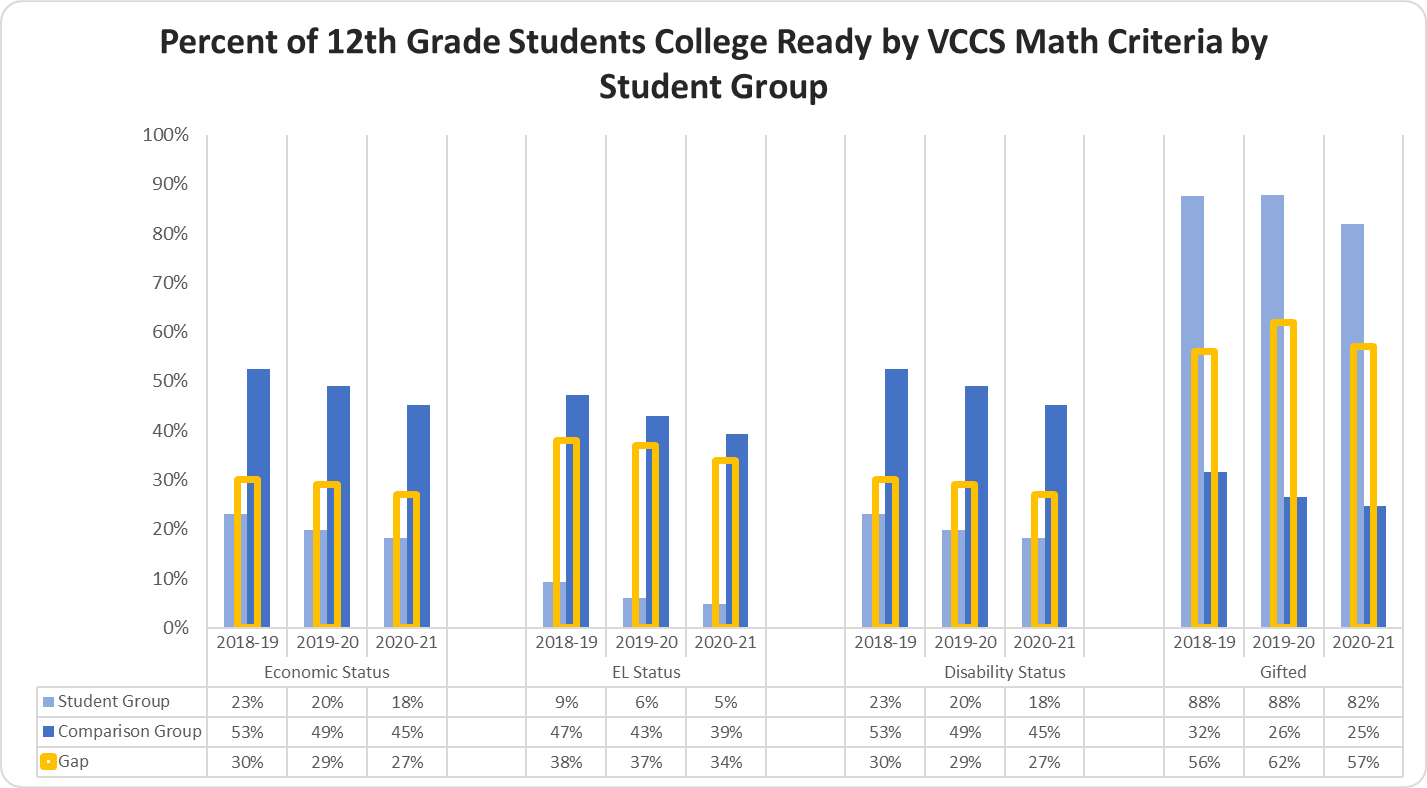
Percent of 12th Graders College Ready by VCCS Math Criteria by Student Group
The Percent of 12th Graders College Ready by VCCS Math Criteria by Student Group graphs display the percentage of 12th graders meeting the VCCS college readiness criteria for Math.
The percentage of Economically Disadvantaged 12th grade students meeting the VCCS college readiness criteria for math in 2018-19 was 23%, 2019-20 was 20%, and 2020-21 was 18%; the percentage of Non-Economically Disadvantaged 12th grade students meeting the VCCS college readiness criteria for math in 2018-19 was 53%, 2019-20 was 49%, and 2020-21 was 45%; the gap between the two groups in 2018-19 was 30%, 2019-20 was 29%, and 2020-21 was 27%.
The percentage of EL 12th grade students meeting the VCCS college readiness criteria for math in 2018-19 was 9%, 2019-20 was 6%, and 2020-21 was 5%; the percentage of Non-EL 12th grade students meeting the VCCS college readiness criteria for math in 2018-19 was 47%, 2019-20 was 43%, and 2020-21 was 39%; the gap between the two groups in 2018-19 was 38%, 2019-20 was 37%, and 2020-21 was 34%.
The percentage of 12th grade Students with Disabilities meeting the VCCS college readiness criteria for math in 2018-19 was 23%, 2019-20 was 20%, and 2020-21 was 18%; the percentage of 12th grade Students without Disabilities meeting the VCCS college readiness criteria for math in 2018-19 was 53%, 2019-20 was 49%, and 2020-21 was 45%; the gap between the two groups in 2018-19 was 30%, 2019-20 was 29%, and 2020-21 was 27%.
The percentage of 12th grade students identified as gifted that were meeting the VCCS college readiness criteria for math in 2018-19 was 88%, 2019-20 was 88%, and 2020-21 was 82%; the percentage of 12th grade students not identified as gifted that were meeting the VCCS college readiness criteria for math in 2018-19 was 32%, 2019-20 was 26%, and 2020-21 was 25%; the gap between the two groups in 2018-19 was 56%, 2019-20 was 62%, and 2020-21 was 57%.
