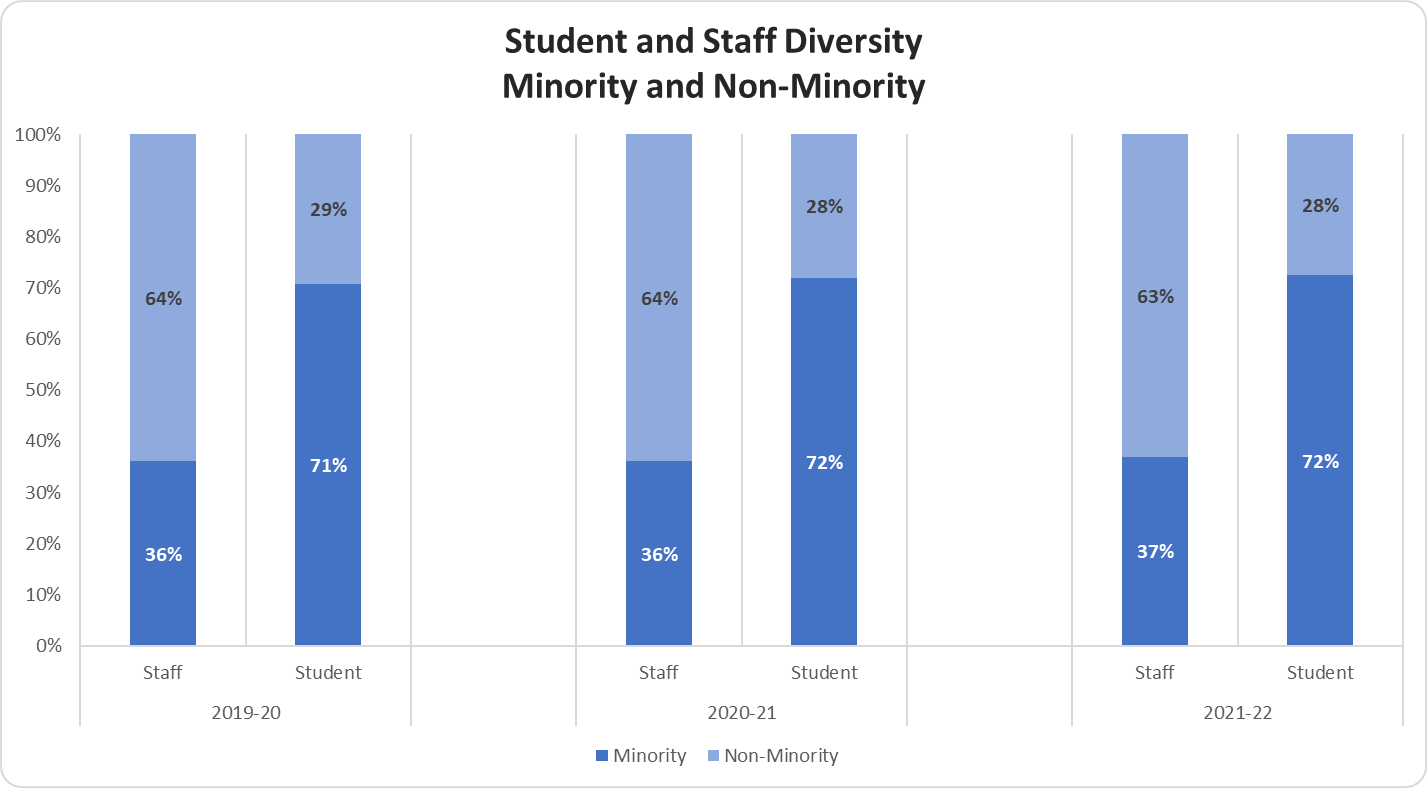
The data shown on this page provides context for the remainder of the Equity Scorecard. The charts show the demographic breakdown of students and staff in Prince William County Public Schools (PWCS) over a three-year time period.
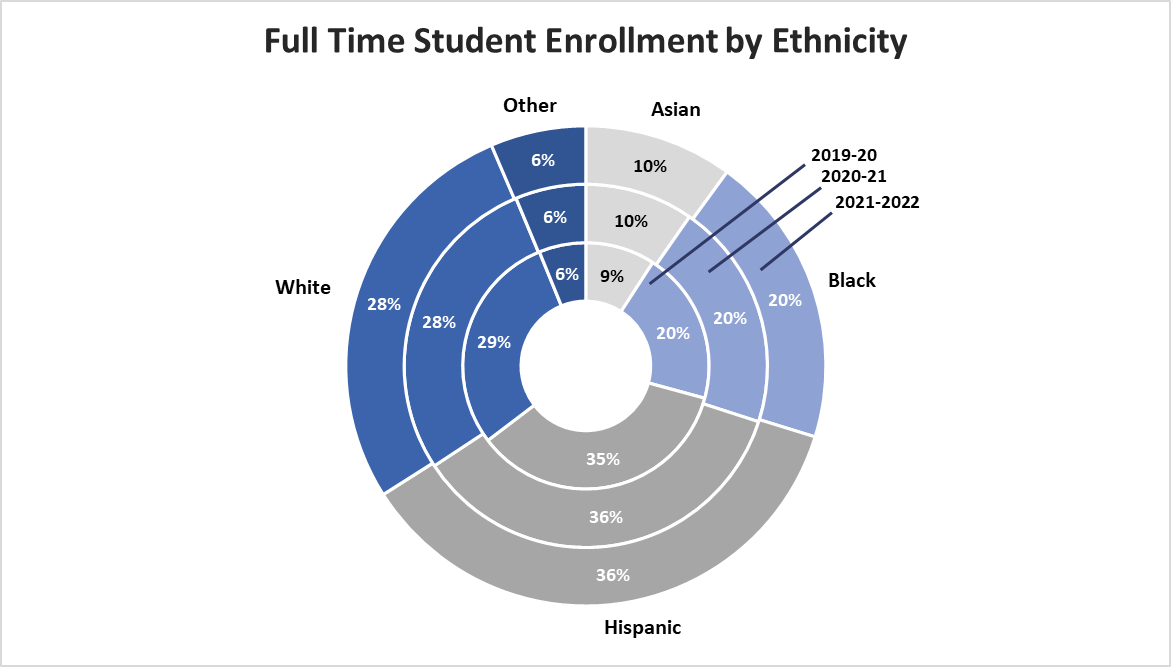
Full Time Student Enrollment by Ethnicity
The
Full-Time
Student
Enrollment
by
Ethnicity
graph
displays
the
percentage
of
students
by
race/ethnicity
category
for
the
most
recent
three
years.
The
percentage
of
Asian
students
in
2019-20
was
9%,
2020-21
was
10%,
and
in
2021-22
was
10%.
The
percentage
of
Black
students
in
2019-20
was
20%,
2020-21
was
20%,
and
2021-22
was
20%.
The
percentage
of
White
students
in
2019-20
was
29%,
2020-21
was
28%,
and
2021-22
was
28%.
The
percentage
of
Hispanic
students
in
2019-20
was
35%,
2020-21
was
36%,
and
2021-22
was
36%.
The
percentage
of
Other
race/ethnicity
students
in
2019-20
was
6%,
2020-21
was
6%,
and
2021-22
was
6%.
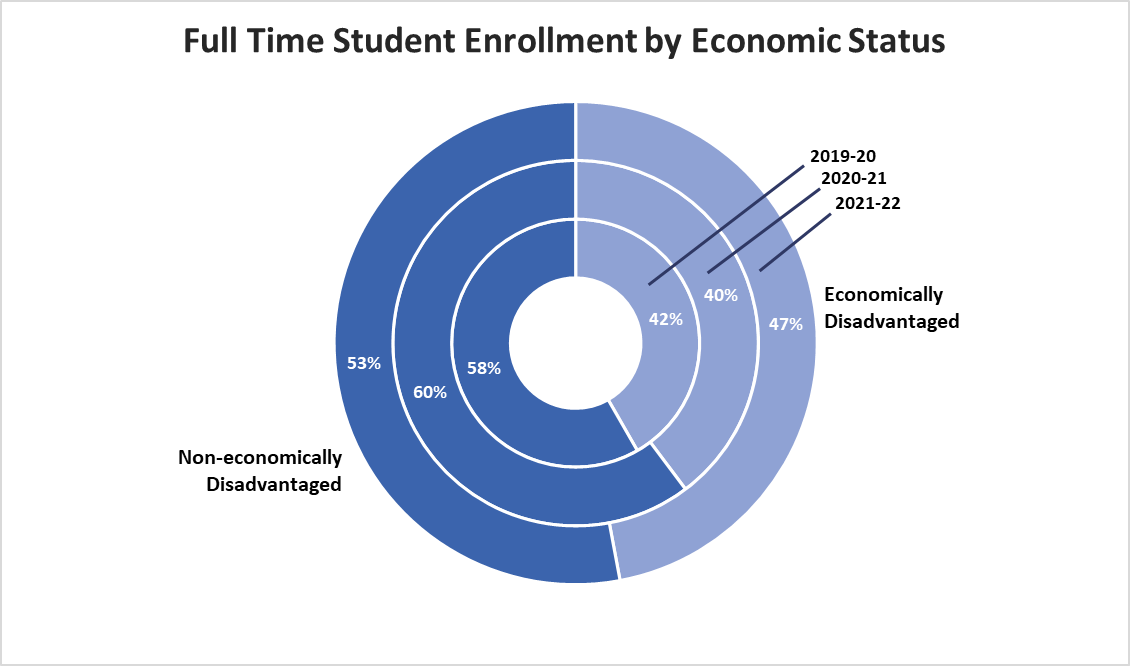
Full Time Student Enrollment by Economic Status
The
Full-Time
Student
Enrollment
by
Economic
Status
graph
displays
the
percentage
of
Economically
Disadvantaged
students
compared
to
non-economically
disadvantaged
students
for
the
most
recent
three
years.
The
percentage
of
Economically
Disadvantaged
students
in
2019-20
was
42%,
2020-21
was
40%,
and
2021-22
was
47%.
The
percentage
of
Non-economically
Disadvantaged
students
in
2019-20
was
58%,
2020-21
was
60%,
and
2021-22
was
53%.
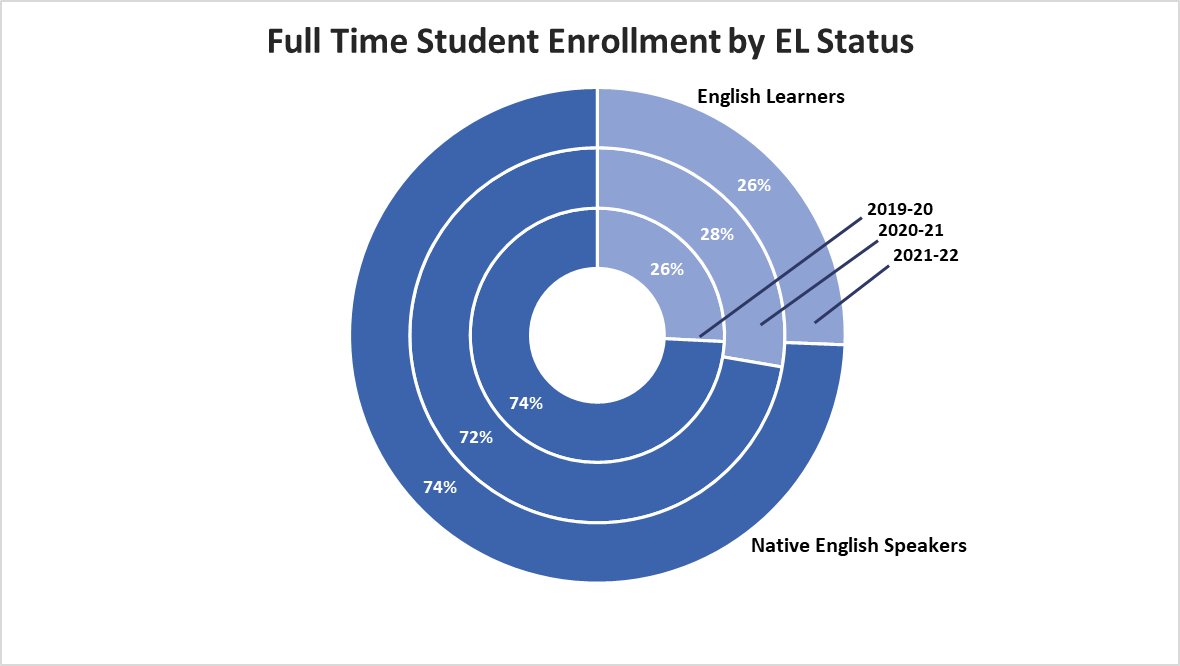
Full Time Student Enrollment by EL Status
The
Full-Time
Student
Enrollment
by
EL
Status
graph
displays
the
percentage
of
English
learner
students
compared
to
native
English-speaking
students
for
the
most
recent
three
years.
The
percentage
of
English
learner
students
in
2019-20
was
26%,
2020-21
was
28%,
and
2021-22
was
26%.
The
percentage
of
native
English
speaker
students
in
2019-20
was
74%,
2020-21
was
72%,
and
2021-22
was
74%.
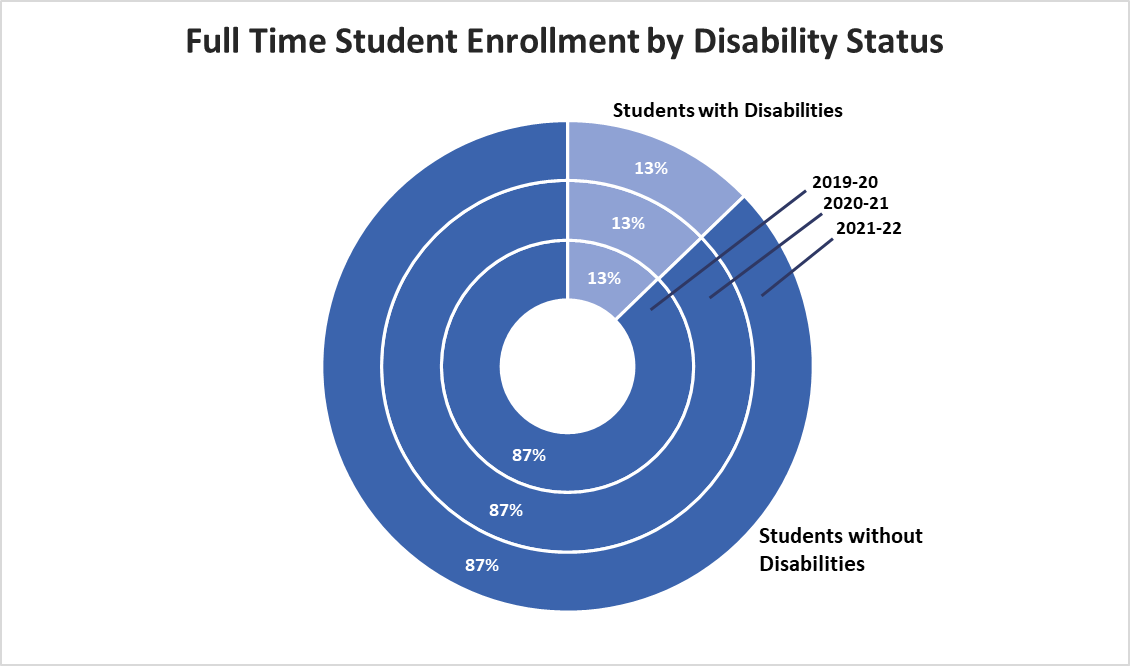
Full Time Student Enrollment by Disability Status
The-Full
Time
Student
Enrollment
by
Disability
Status
graph
displays
the
percentage
of
students
with
disabilities
compared
to
students
without
disabilities
for
the
most
recent
three
years.
The
percentage
of
Students
with
Disabilities
2019-20
was
13%,
2020-21
was
13%,
and
2021-22
was
13%.
The
percentage
of
Students
without
Disabilities
2019-20
was
87%,
2020-21
was
87%,
and
2021-22
was
87%.
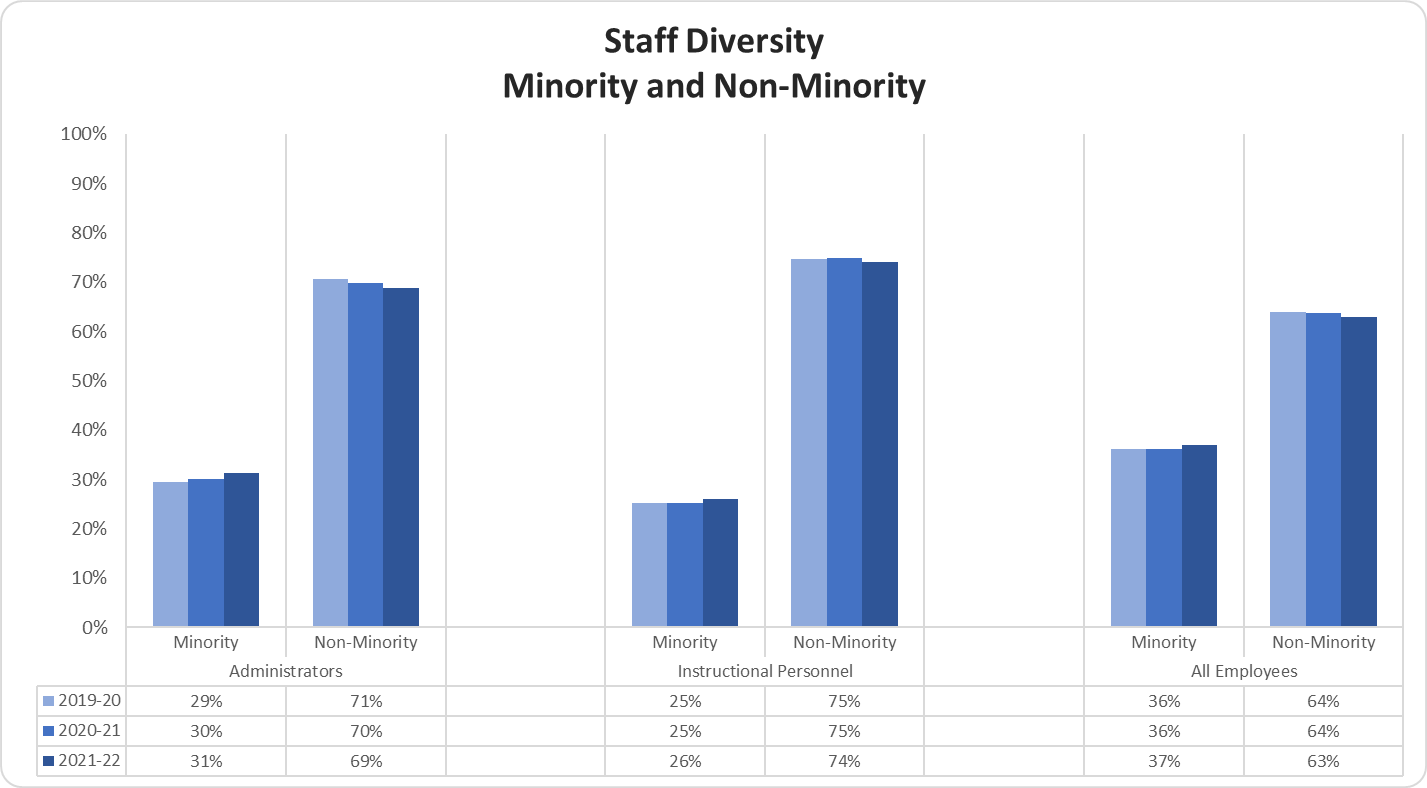
Staff Diversity Minority and Non-Minority
The Staff Diversity Minority vs. Non-Minority graph displays the percentage of staff identified as minority compared to non-minority for administrators, instructional personnel, and all employee categories for the most recent three years.
The percentage of Minority Administrators in 2019-20 was 29%, 2020-21 was 30%, and 2021-22 was 31%. The percentage of Minority Instructional Personnel in 2019-20 was 25%, 2020-21 was 25%, and 2021-22 was 26%. The percentage of Minority Employees in 2019-20 was 36%, 2020-21 was 36%, and 2021-22 was 37%. The percentage of Non-Minority Administrators in 2019-20 was 71%, 2020-21 was 70%, and 2021-22 was 69%. The percentage of Non-Minority Instructional Personnel in 2019-20 was 75%, 2020-21 was 75%, and 2021-22 was 74%. The percentage of Non-Minority Employees in 2019-20 was 64%, 2020-21 was 64%, and 2021-22 was 63%.
Student and Staff Diversity Minority vs. Non-Minority
The Student and Staff Diversity Minority vs. Non-Minority graph displays the percentage of students and staff identified as minority compared to non-minority for the most recent three years.
The percentage of Minority Students in 2019-20 was 71%, 2020-21 was 72%, and 2021-22 was 72%. The percentage of Minority Employees in 2019-20 was 36%, 2020-21 was 36%, and 2021-22 was 37%. The percentage of Non-Minority Students in 2019-20 was 29%, 2020-21 was 28%, and 2021-22 was 28%. The percentage of Non-Minority Employees in 2019-20 was 64%, 2020-21 was 64%, and 2021-22 was 63%.
