Another key aspect of equity is the learning climate. The data shown on this page include discipline data, as well as a few other data points. The discipline data presented include the percentage of students with one or more discipline referrals, as well as the percentage of students receiving exclusionary discipline. Data are presented at the division level (by ethnicity, student group, and gender), as well as by level (elementary, middle, and high).
In addition, there are data charts showing teacher quality measures at Title I and non-Title I schools (comparing PWCS and the state) as well as charts showing the number of computers at Title I and non-Title I schools per 100 students.
NOTE: Updated information for discipline indicators is not available due to the impact of COVID-19 on schools and remote instruction during the 2020-21 school year. Listed below is discipline data for the 2017-18, 2018-19, and 2019-20 school years.
Discipline - Division
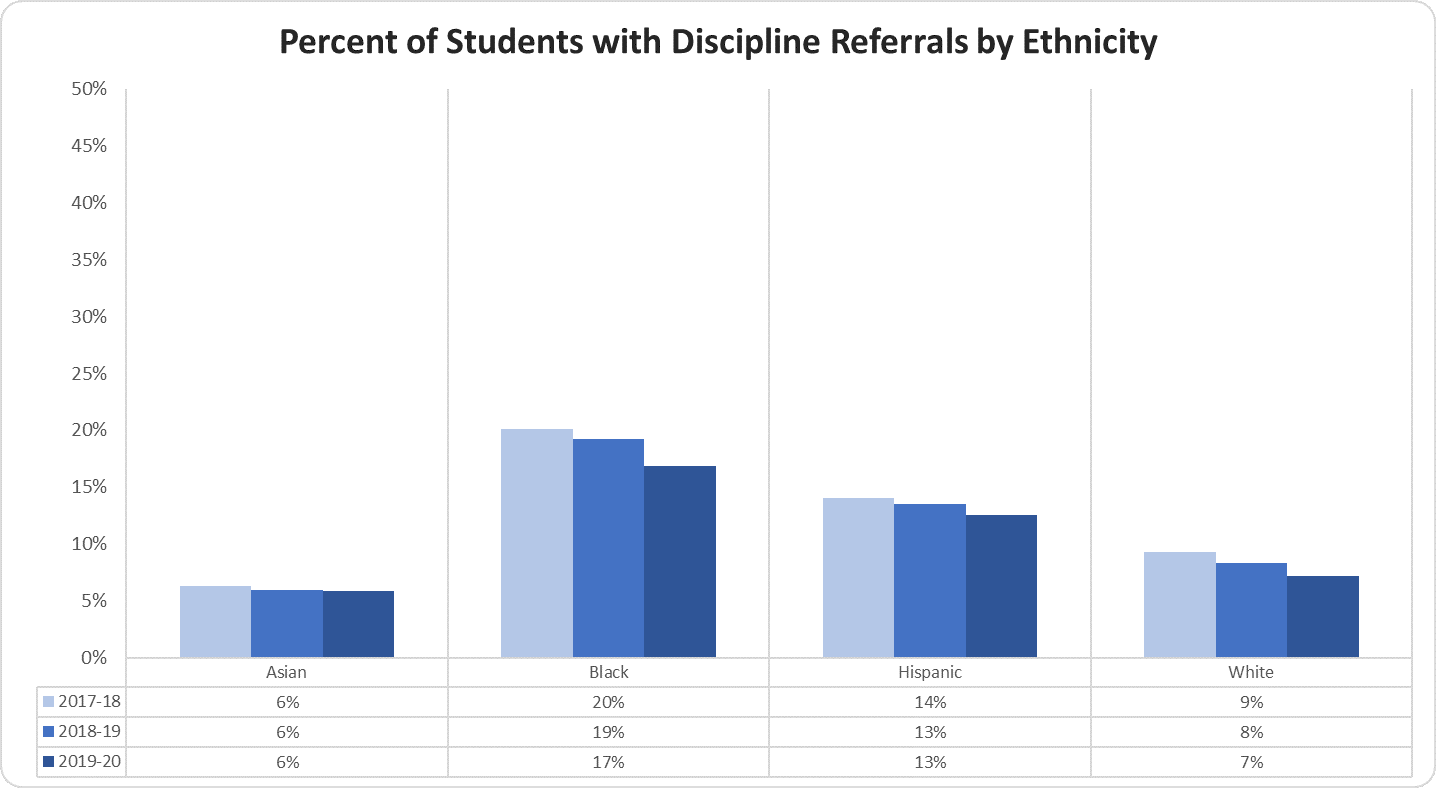
Percentage of Students with Discipline Referrals by Ethnicity
The Percent of Students with Discipline Referrals by Ethnicity graph displays the percentage of students with discipline referrals for the most recent three years.
The percentage of Asian students with discipline referrals in 2017-18 was 6%, 2018-19 was 6%, and 2019-20 was 6%; the percentage of Black students with discipline referrals in 2017-18 was 20%, 2018-19 was 19%, and 2019-20 was 17%; the percentage of Hispanic students with discipline referrals in 2017-18 was 14%, 2018-19 was 13%, and 2019-20 was 13%; the percentage of white students with discipline referrals in 2017-18 was 9%, 2018-19 was 8%, and 2019-20 was 7%.
Percentage of Students with Discipline Referrals by Student Group
The Percent of Students with Discipline Referrals by Student Group graph displays the percentage of students with discipline referrals for the most recent three years.
The percentage of economically disadvantaged students with discipline referrals in 2017-18 was 16%, in 2018-19 was 16%, and in 2019-20 was 14%; the non-economically disadvantaged students with discipline referrals in 2017-18 was 10%, in 2018-19 was 10%, and in 2019-20 was 9%; the gap between the two groups in 2017-18 was 6%, in 2018-19 was 6%, and in 2019-20 was 5%.
The percentage of EL students with discipline referrals in 2017-18 was 12%, in 2018-19 was 11%, and in 2019-20 was 10%; the non-EL students with discipline referrals in 2017-18 was 13%, in 2018-19 was 13%, and in 2019-20 was 11%; the gap between the two groups in 2017-18 was 1%, in 2018-19 was 2%, and in 2019-20 was 1%.
The percentage of special education students with discipline referrals in 2017-18 was 21%, in 2018-19 was 19%, and in 2019-20 was 16%; the non-special education students with discipline referrals in 2017-18 was 12%, in 2018-19 was 11%, and in 2019-20 was 10%; the gap between the two groups in 2017-18 was 9%, in 2018-19 was 8%, and in 2019-20 was 6%.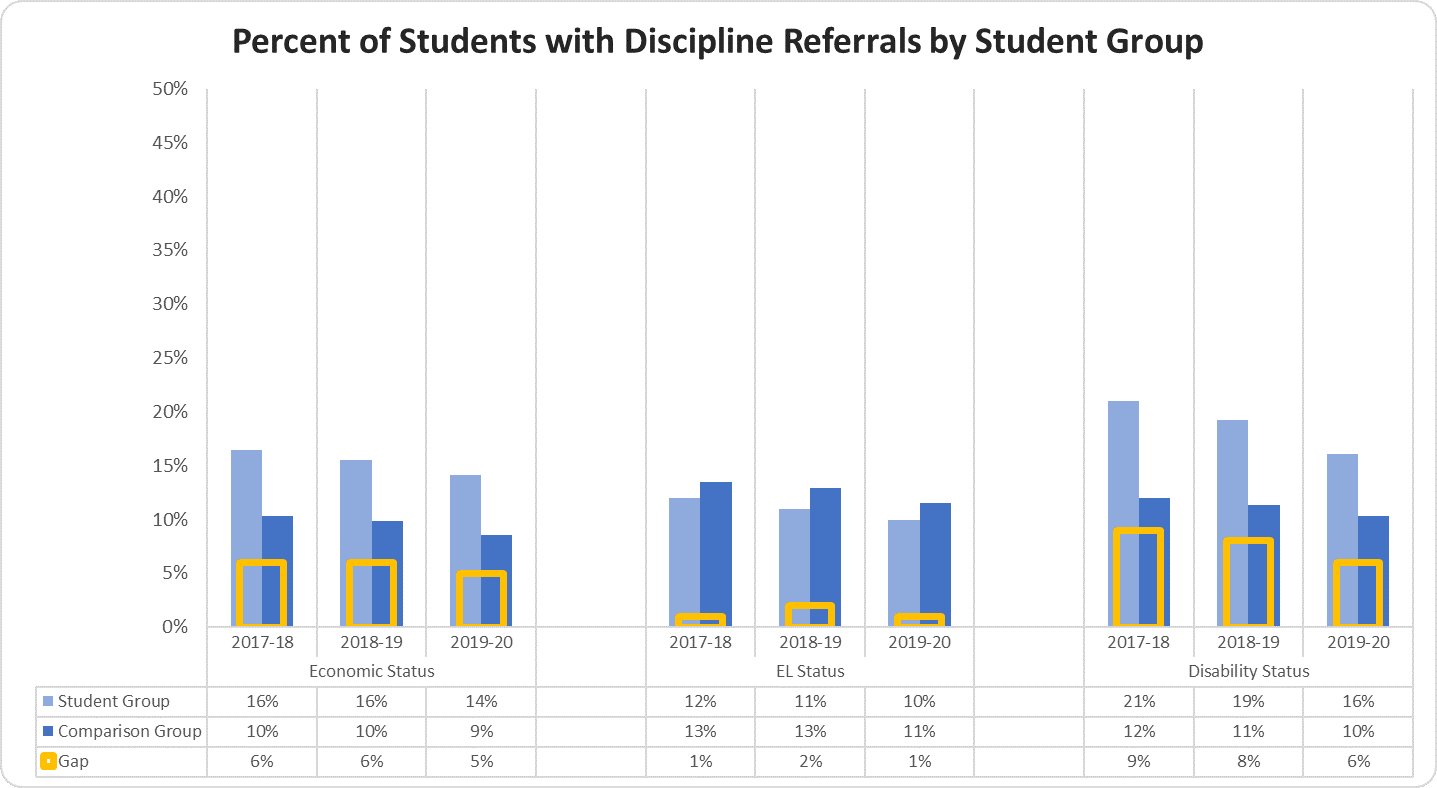
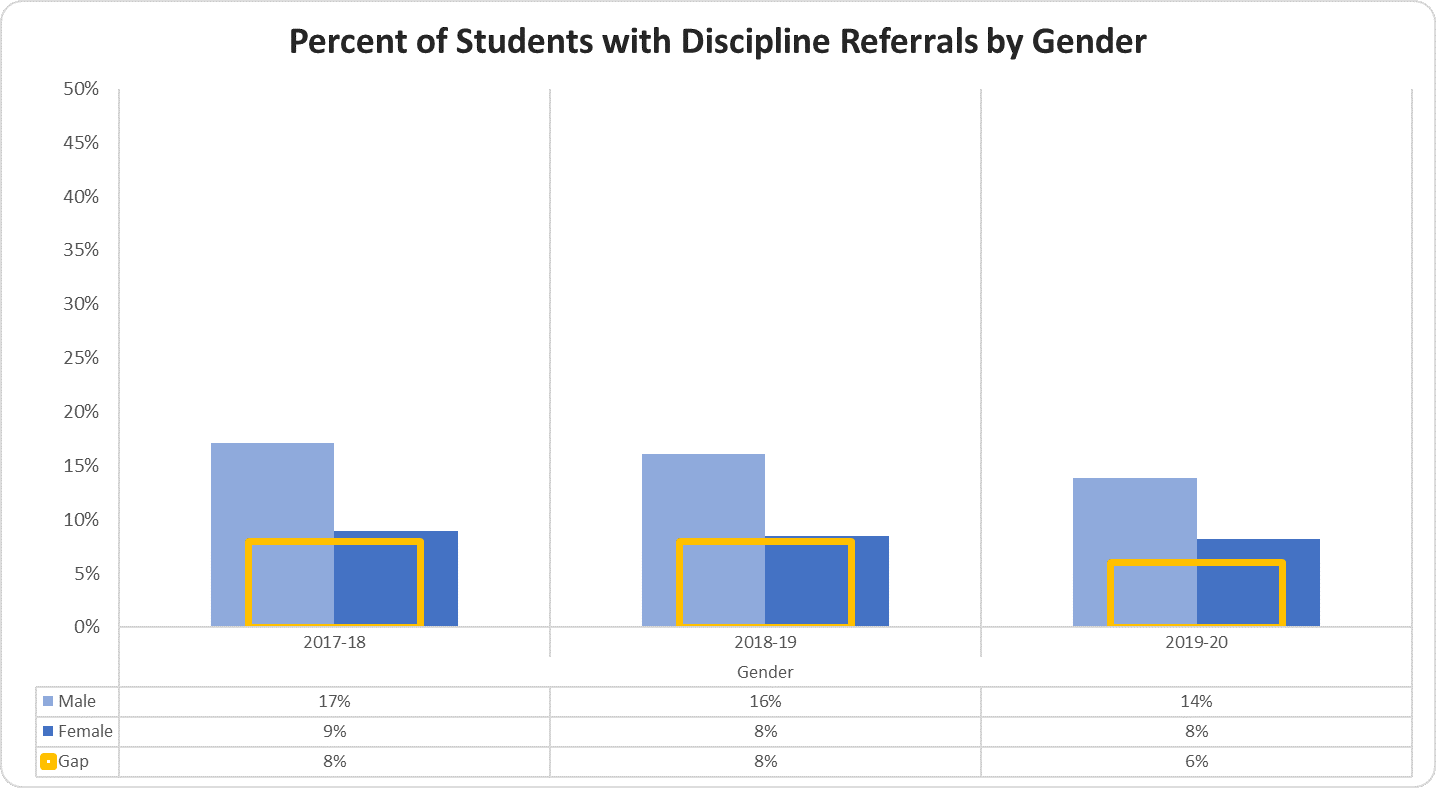
Percentage of Students with Discipline Referrals by Gender
The Percent of Students with Discipline Referrals by Gender graph displays the percentage of students with discipline referrals for the most recent three years.
The percentage of male students with discipline referrals in 2017-18 was 17%, in 2018-19 was 16% and in 2019-20 was 14%; the female students with discipline referrals in 2017-18 was 9%, in 2018-19 was 8% and in 2019-20 was 8%; the gap between the two groups in 2017-18 was 8%, in 2018-19 was 8% and in 2019-20 was 6%.
Percentage of Students with Exclusionary Discipline by Ethnicity
The Percent of Students with Exclusionary Discipline by Ethnicity graph displays the percentage of students with exclusionary discipline for the most recent three years.
The percentage of Asian students with exclusionary discipline in 2017-18 was 2%, 2018-19 was 2%, and 2019-20 was 1%; the percentage of Black students with exclusionary discipline in 2017-18 was 9%, 2018-19 was 9%, and 2019-20 was 5%; the percentage of Hispanic students with exclusionary discipline in 2017-18 was 6%, 2018-19 was 6%, and 2019-20 was 4%; the percentage of white students with exclusionary discipline in 2017-18 was 3%, 2018-19 was 3%, and 2019-20 was 2%.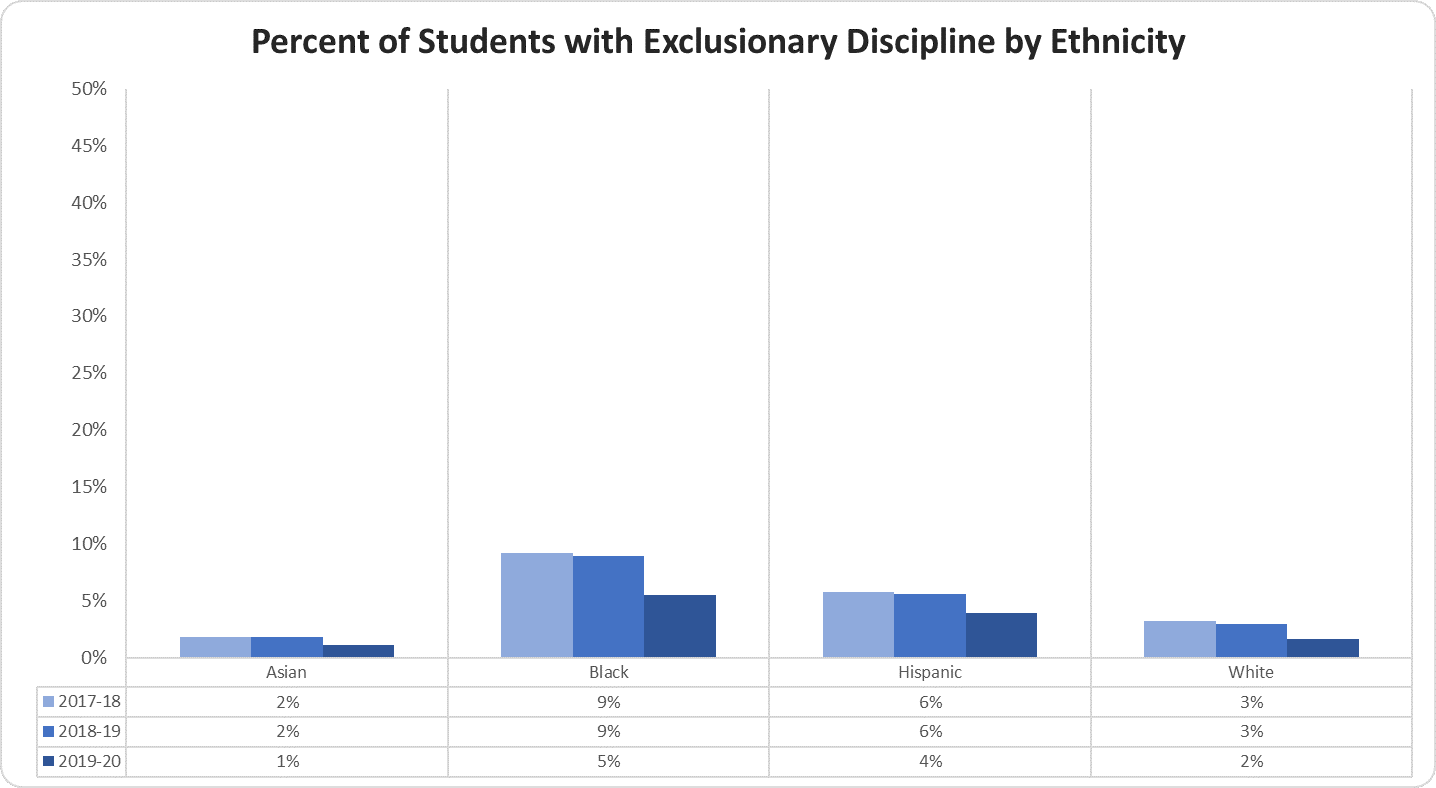
Percentage of Students with Exclusionary Discipline by Student Group
The Percent of Students with Exclusionary Discipline by Student Group graph displays the percentage of students with exclusionary discipline for the most recent three years.
The percentage of economically disadvantaged students with exclusionary discipline in 2017-18 was 8%, in 2018-19 was 7%, and in 2019-20 was 5%; the non-economically disadvantaged students with exclusionary discipline in 2017-18 was 3%, in 2018-19 was 3%, and in 2019-20 was 2%; the gap between the two groups in 2017-18 was 5%, in 2018-19 was 4%, and in 2019-20 was 3%.
The percentage of EL students with exclusionary discipline in 2017-18 was 5%, 2018-19 was 5%, and in 2019-20 was 3%; the non-EL students with exclusionary discipline in 2017-18 was 5%, in 2018-19 was 5%, and in 2019-20 was 3%; the gap between the two groups in 2017-18 was 0%, in 2018-19 was 0%, and in 2019-20 was 0%.
The percentage of special education students with exclusionary discipline in 2017-18 was 11%, 2018-19 was 10%, and in 2019-20 was 6%; the non-special education students with exclusionary discipline in 2017-18 was 4%, 2018-19 was 4%, and 2019-20 was 3%; the gap between the two groups in 2017-18 was 7%, in 2018-19 was 6%, and in 2019-20 was 3%.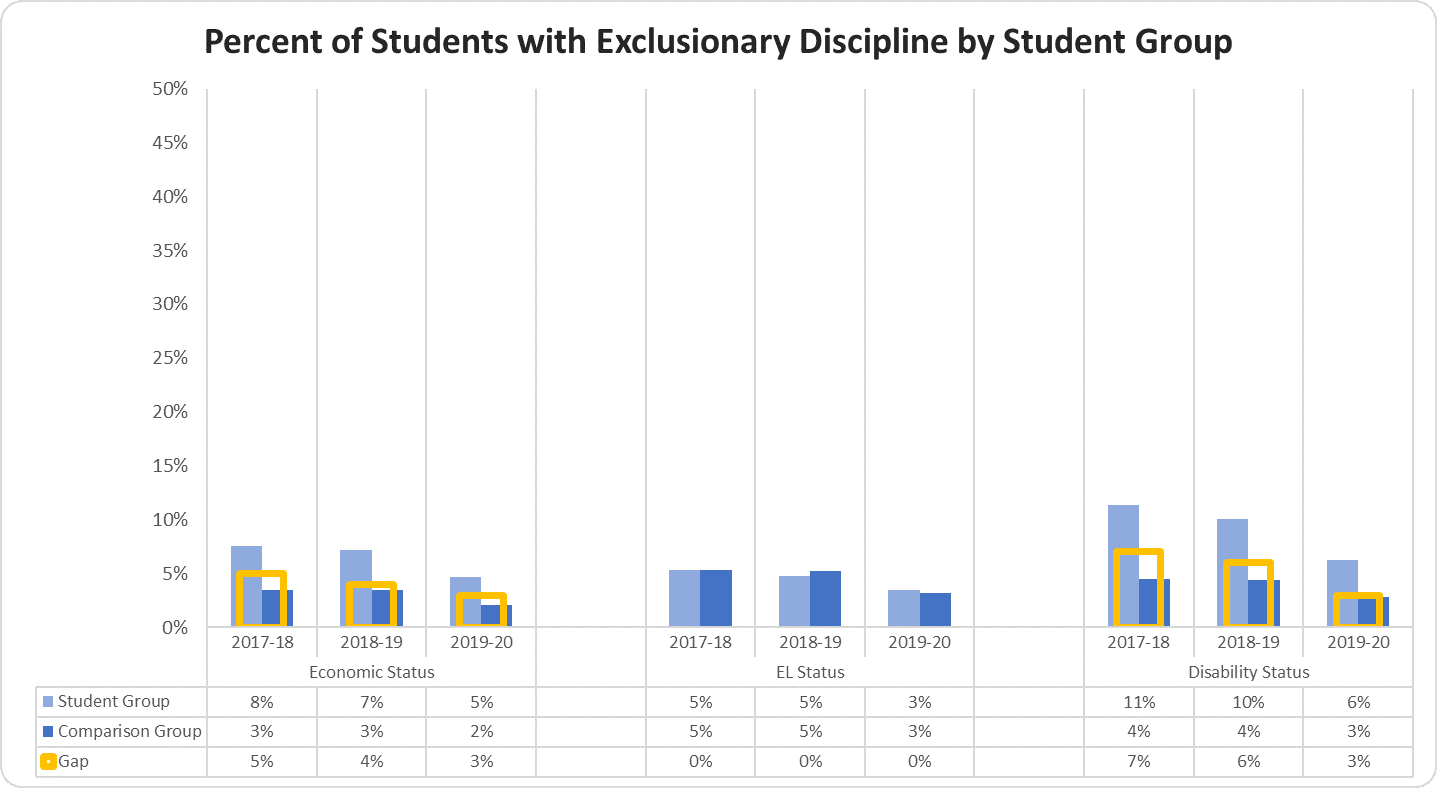
Percentage of Students with Exclusionary Discipline by Gender
The Percent of Students with Exclusionary Discipline by Gender graph displays the percentage of students with exclusionary discipline for the most recent three years.
The percentage of male students with exclusionary discipline in 2017-18 was 8%, in 2018-19 was 7% and in 2019-20 was 5%; the female students with exclusionary discipline in 2017-18 was 3%, in 2018-19 was 3% and in 2019-20 was 2%; the gap between the two groups in 2017-18 was 5%, in 2018-19 was 4% and in 2019-20 was 3%. 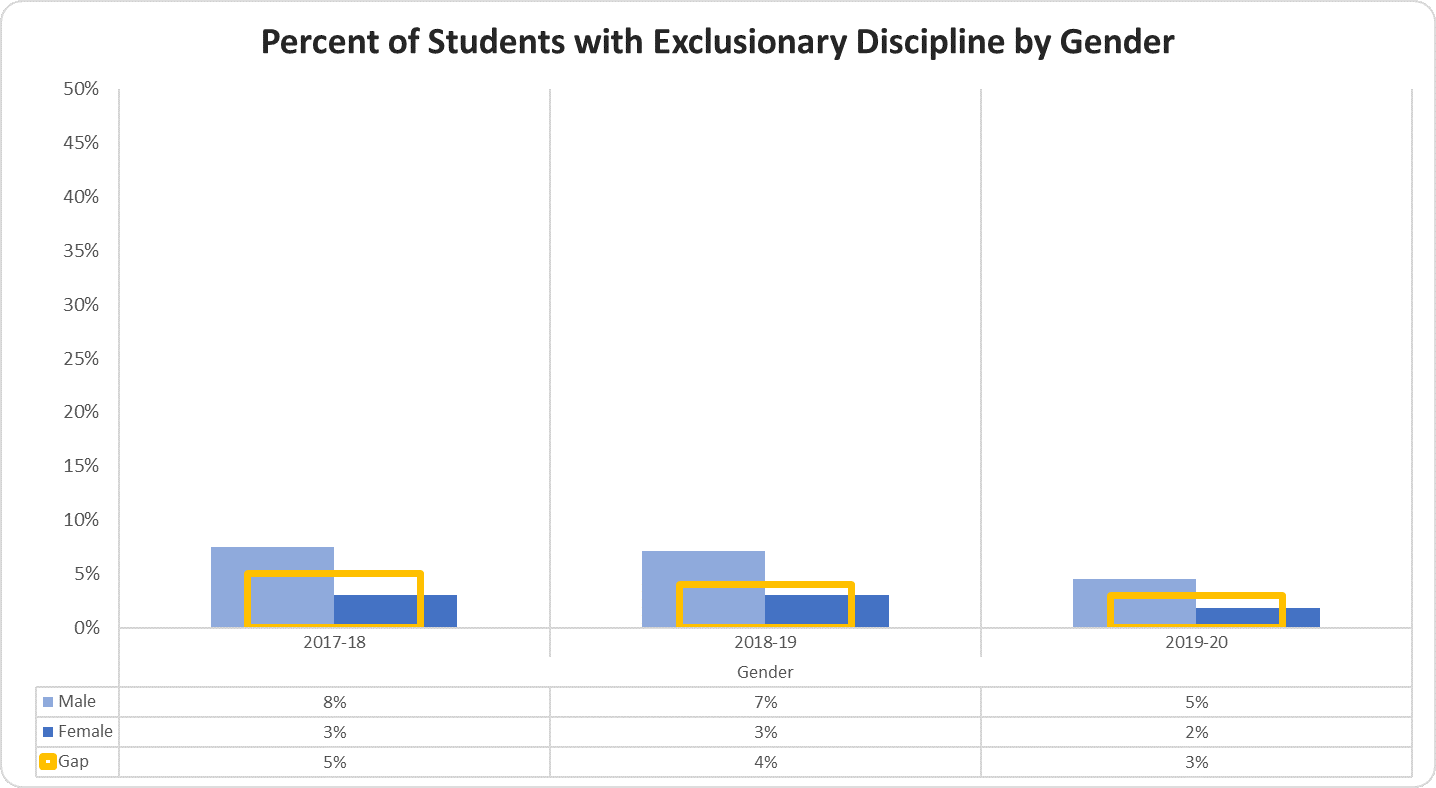
Discipline - Elementary
Elementary Schools Percent of Students with Exclusionary Discipline by Ethnicity
The
Elementary
Schools
Percent
of
Students
with
Exclusionary
Discipline
by
Ethnicity
graph
displays
the
percentage
of
students
with
exclusionary
discipline
for
the
most
recent
three
years.
The
percentage
of
Asian
students
with
exclusionary
discipline
in
2017-18
was
1%,
2018-19
was
0%,
and
2019-20
was
0%;
the
percentage
of
Black
students
with
exclusionary
discipline
in
2017-18
was
4%,
2018-19
was
3%,
and
2019-20
was
2%;
the
percentage
of
Hispanic
students
with
exclusionary
discipline
in
2017-18
was
2%,
2018-19
was
1%,
and
2019-20
was
1%;
the
percentage
of
White
students
with
exclusionary
discipline
in
2017-18
was
2%,
2018-19
was
1%,
and
2019-20
was
1%.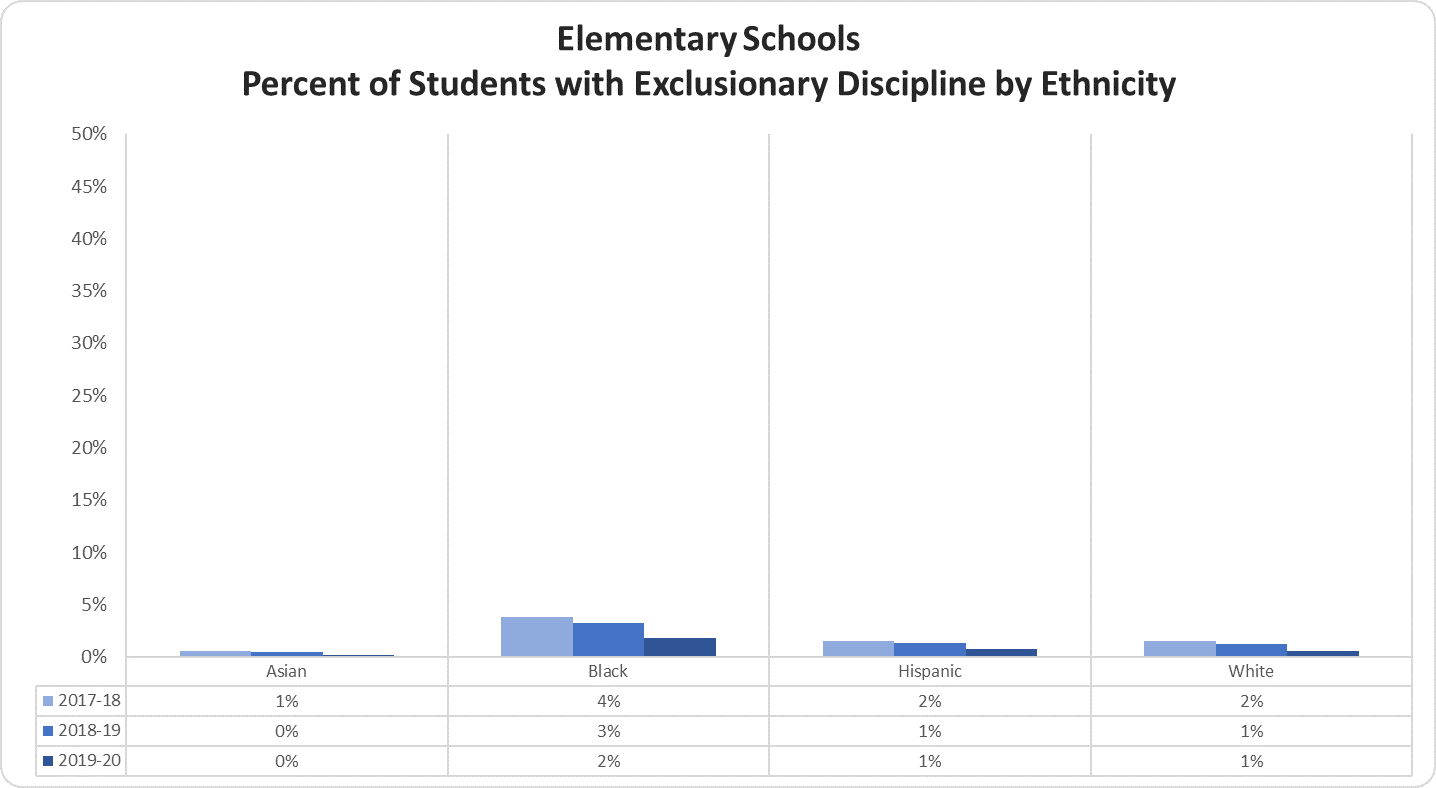
Elementary Schools Percent of Students with Exclusionary Discipline by Student Group
The
Elementary
Schools
Percent
of
Students
with
Exclusionary
Discipline
by
Student
Group
graph
displays
the
percentage
of
students
with
exclusionary
discipline
for
the
most
recent
three
years.
The
percentage
of
economically
disadvantaged
students
with
exclusionary
discipline
in
2017-18
was
3%,
in
2018-19
was
2%,
and
in
2019-20
was
1%;
the
non-economically
disadvantaged
students
with
exclusionary
discipline
in
2017-18
was
1%,
in
2018-19
was
1%,
and
in
2019-20
was
1%;
the
gap
between
the
two
groups
in
2017-18
was
2%,
in
2018-19
was
1%,
and
in
2019-20
was
0%.
The
percentage
of
EL
students
with
exclusionary
discipline
in
2017-18
was
2%,
2018-19
was
1%,
and
in
2019-20
was
1%;
the
non-EL
students
with
exclusionary
discipline
in
2017-18
was
2%,
in
2018-19
was
2%,
and
in
2019-20
was
1%;
the
gap
between
the
two
groups
in
2017-18
was
0%,
in
2018-19
was
1%,
and
in
2019-20
was
0%.
The
percentage
of
Special
Education
students
with
exclusionary
discipline
in
2017-18
was
6%,
2018-19
was
5%,
and
2019-20
was
3%;
the
non-Special
Education
students
with
exclusionary
discipline
in
2017-18
was
1%,
2018-19
was
1%,
and
in
2019-20
was
1%;
the
gap
between
the
two
groups
in
2017-18
was
5%,
in
2018-19
was
4%,
and
in
2019-20
was
2%.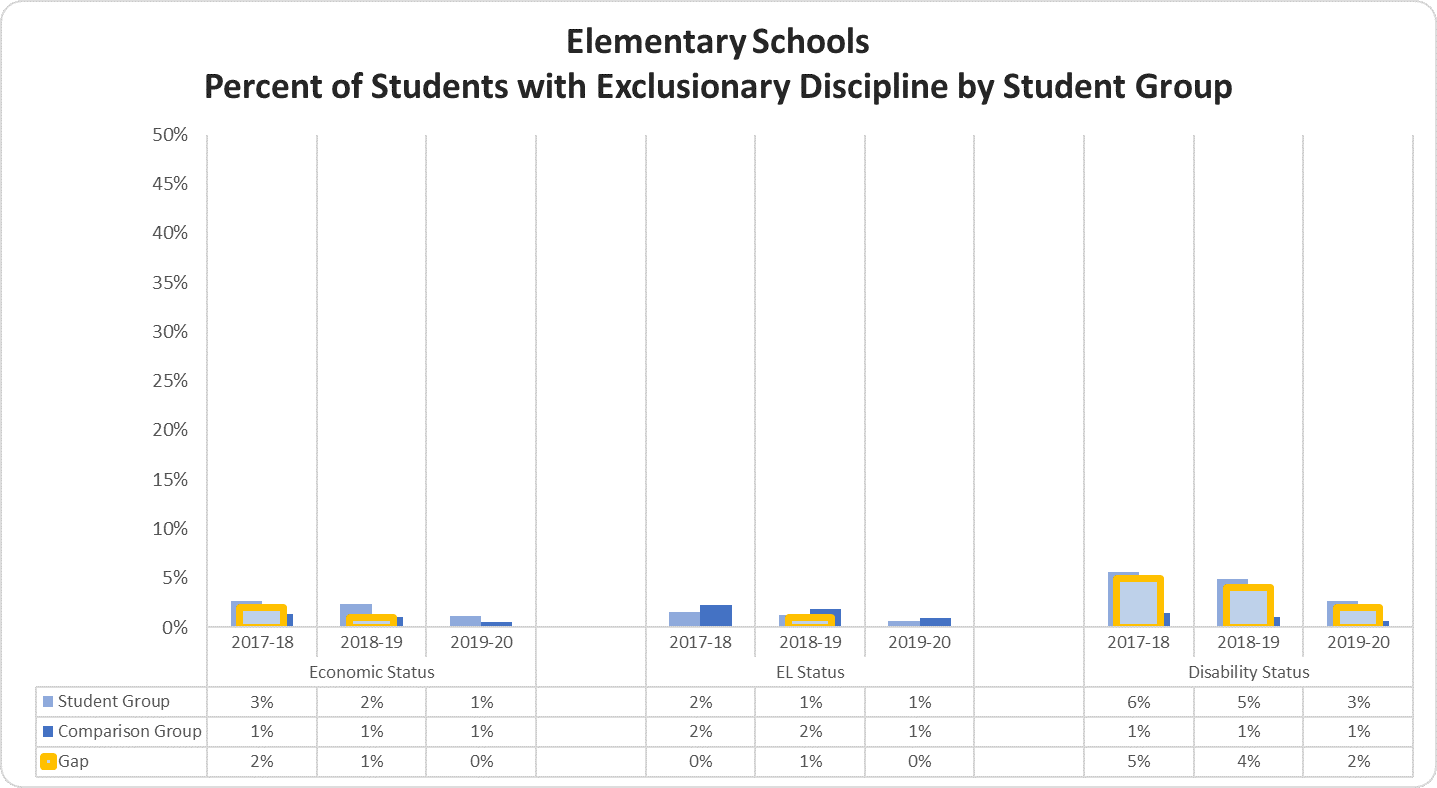
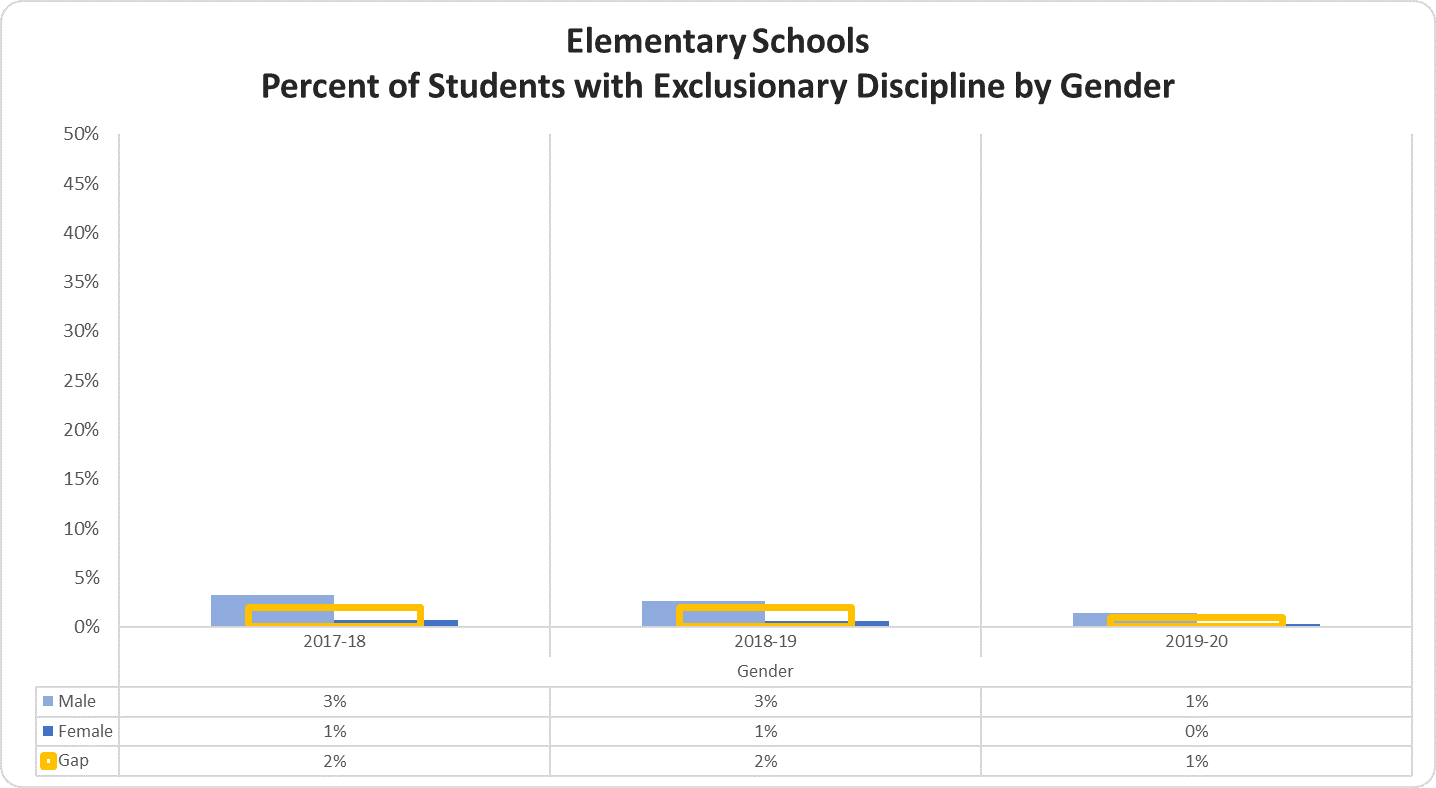
Elementary Schools Percent of Students with Exclusionary Discipline by Gender
The
Elementary
Schools
Percent
of
Students
with
Exclusionary
Discipline
by
Gender
graph
displays
the
percentage
of
students
with
exclusionary
discipline
for
the
most
recent
three
years.
The
percentage
of
male
students
with
exclusionary
discipline
in
2017-18
was
3%,
in
2018-19
was
3%,
and
in
2019-20
was
1%;
the
female
students
with
exclusionary
discipline
in
2017-18
was
1%,
in
2018-19
was
1%,
and
in
2019-20
was
0%;
the
gap
between
the
two
groups
in
2017-18
was
2%,
in
2018-19
was
2%,
and
in
2019-20
was
1%.
Discipline - Middle
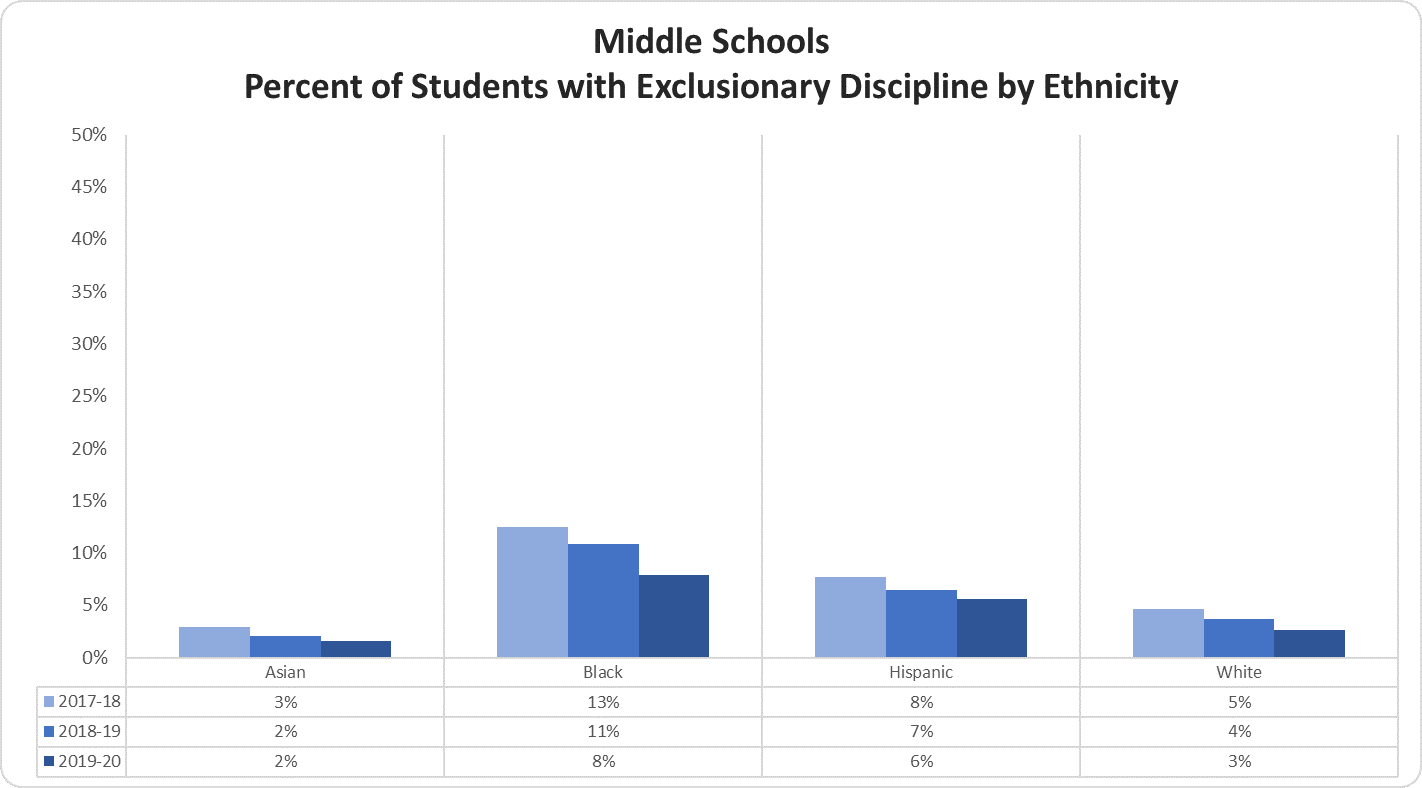
Middle Schools Percentage of Students with Exclusionary Discipline by Ethnicity
The Middle Schools Percent of Students with Exclusionary Discipline by Ethnicity graph displays the percentage of students with exclusionary discipline for the most recent three years.
The percentage of Asian students with exclusionary discipline in 2017-18 was 3%, 2018-19 was 2%, and 2019-20 was 2%; the percentage of Black students with exclusionary discipline in 2017-18 was 13%, 2018-19 was 11%, and 2019-20 was 8%; the percentage of Hispanic students with exclusionary discipline in 2017-18 was 8%, 2018-19 was 7%, and 2019-20 was 6%; the percentage of Wwhite students with exclusionary discipline in 2017-18 was 5%, 2018-19 was 4%, and 2019-20 was 3%.
Middle Schools Percentage of Students with Exclusionary Discipline by Student Group
The Middle Schools Percent of Students with Exclusionary Discipline by Student Group graph displays the percentage of students with exclusionary discipline for the most recent three years.
The percentage of economically disadvantaged students with exclusionary discipline in 2017-18 was 10%, in 2018-19 was 9%, and in 2019-20 was 7%; the non-economically disadvantaged students with exclusionary discipline in 2017-18 was 5%, in 2018-19 was 4%, and in 2019-20 was 3%; the gap between the two groups in 2017-18 was 5%, in 2018-19 was 5%, and in 2019-20 was 4%.
The percentage of EL students with exclusionary discipline in 2017-18 was 8%, 2018-19 was 6%, and in 2019-20 was 6%; the non-EL students with exclusionary discipline in 2017-18 was 7%, in 2018-19 was 6%, and in 2019-20 was 4%; the gap between the two groups in 2017-18 was 1%, in 2018-19 was 0%, and in 2019-20 was 2%.
The percentage of special education students with exclusionary discipline in 2017-18 was 15%, 2018-19 was 12%, and in 2019-20 was 9%; the non-Special Education students with exclusionary discipline in 2017-18 was 6%, 2018-19 was 5%, and in 2019-20 was 4%; the gap between the two groups in 2017-18 was 9%, in 2018-19 was 7%, and in 2019-20 was 5%.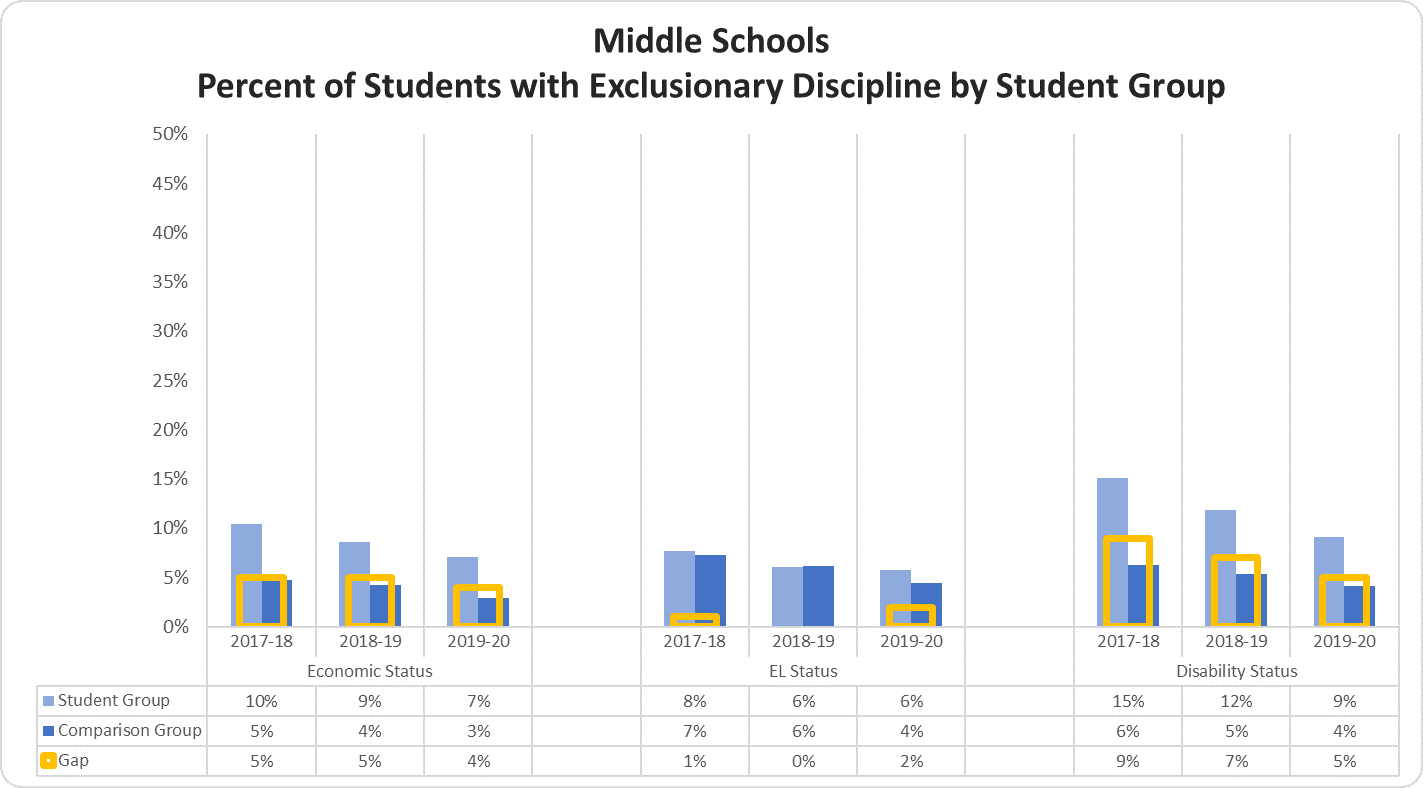
Middle Schools Percentage of Students with Exclusionary Discipline by Gender
The Middle Schools Percent of Students with Exclusionary Discipline by Gender graph displays the percentage of students with exclusionary discipline for the most recent three years.
The percentage of male students with exclusionary discipline in 2017-18 was 11%, in 2018-19 was 9%, and in 2019-20 was 7%; the female students with exclusionary discipline in 2017-18 was 4%, in 2018-19 was 3%, and in 2019-20 was 3%; the gap between the two groups in 2017-18 was 7%, in 2018-19 was 6%, and in 2019-20 was 4%.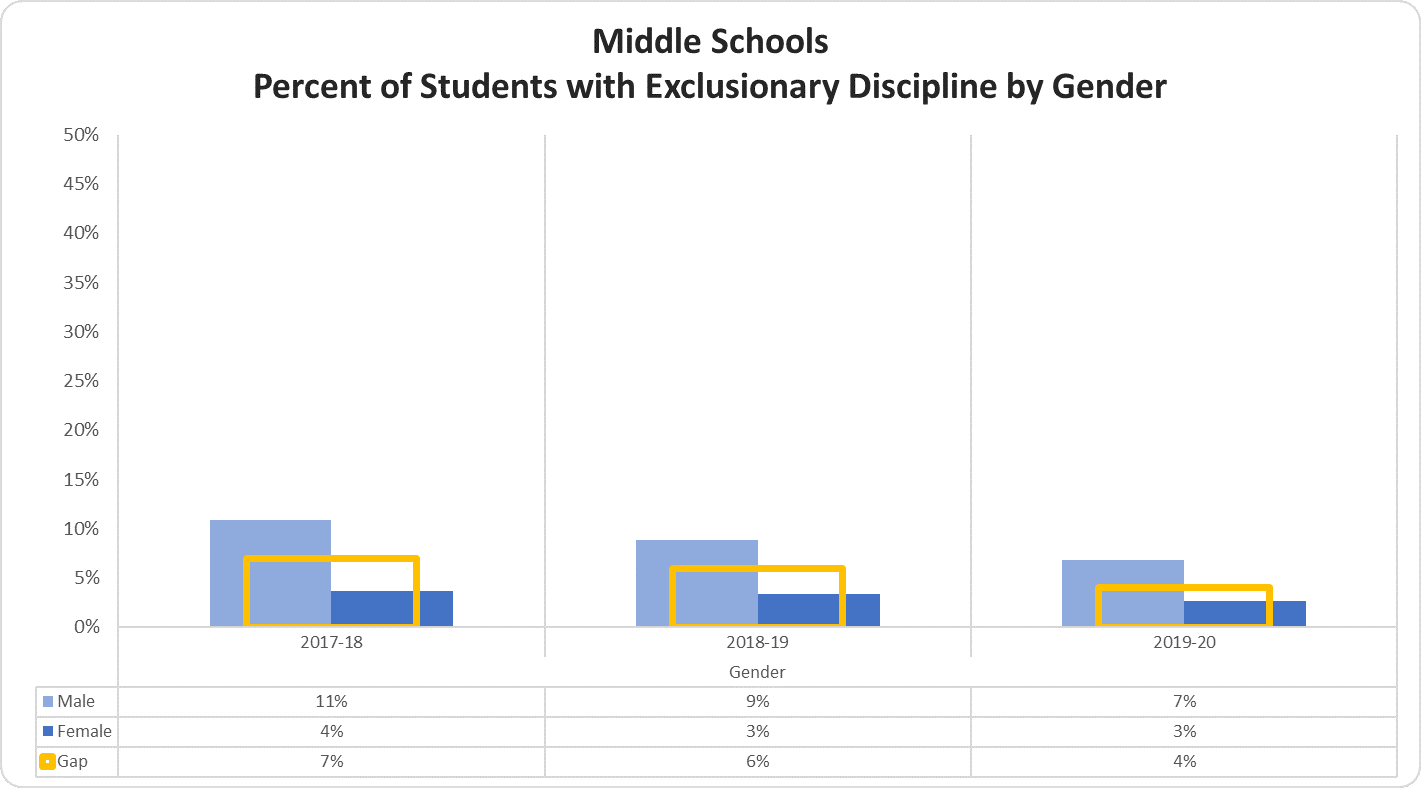
Discipline - High
High Schools Percentage of Students with Exclusionary Discipline by Ethnicity
The High Schools Percent of Students with Exclusionary Discipline by Ethnicity graph displays the percentage of students with exclusionary discipline for the most recent three years.
The percentage of Asian students with exclusionary discipline in 2017-18 was 3%, 2018-19 was 4%, and 2019-20 was 2%; the percentage of Black students with exclusionary discipline in 2017-18 was 14%, 2018-19 was 15%, and 2019-20 was 9%; the percentage of Hispanic students with exclusionary discipline in 2017-18 was 11%, 2018-19 was 11%, and 2019-20 was 7%; the percentage of white students with exclusionary discipline in 2017-18 was 4%, 2018-19 was 5%, and 2019-20 was 2%.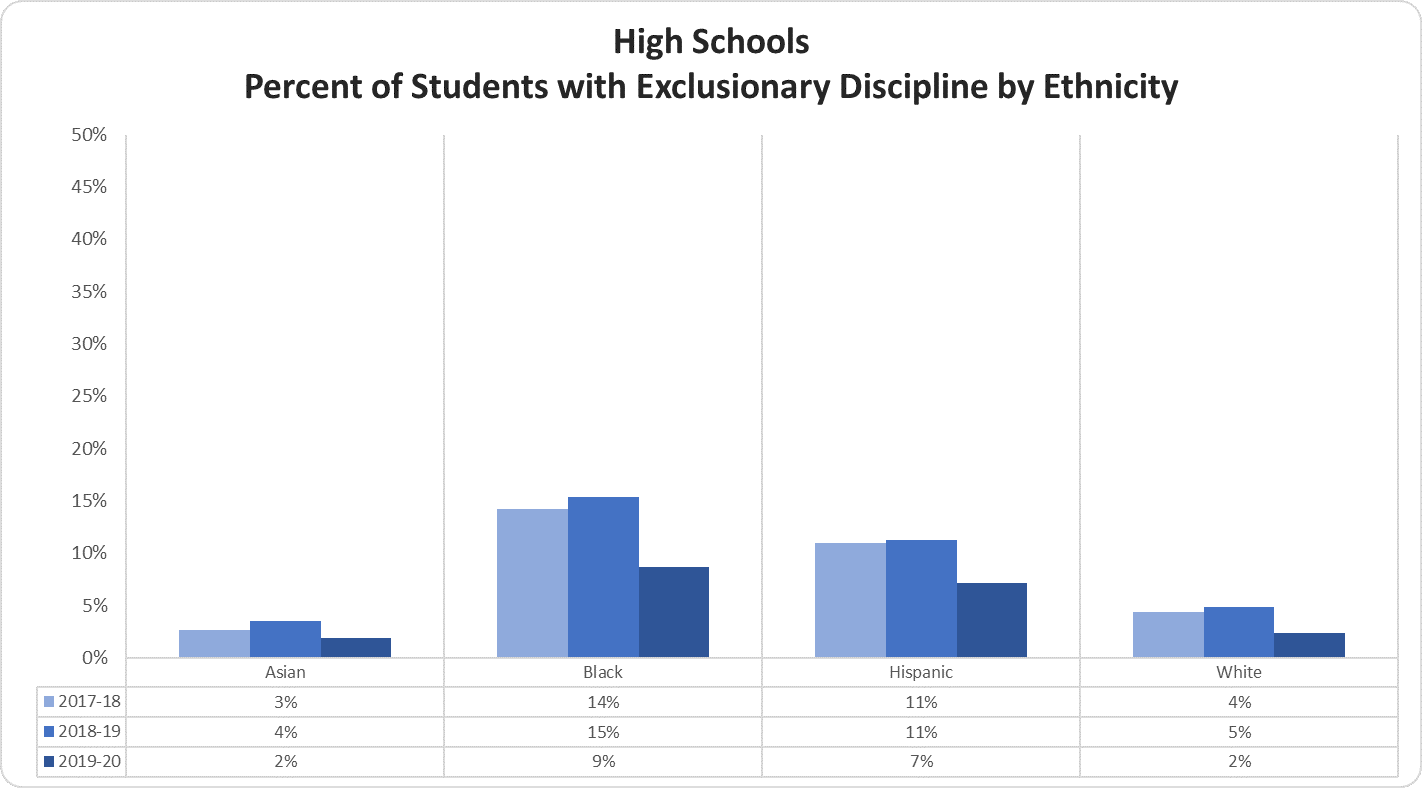
High Schools Percentage of Students with Exclusionary Discipline by Student Group
The High Schools Percent of Students with Exclusionary Discipline by Student Group graph displays the percentage of students with exclusionary discipline for the most recent three years.
The percentage of economically disadvantaged students with exclusionary discipline in 2017-18 was 13%, in 2018-19 was 14%, and in 2019-20 was 8%; the non-economically disadvantaged students with exclusionary discipline in 2017-18 was 5%, in 2018-19 was 6%, and in 2019-20 was 3%; the gap between the two groups in 2017-18 was 8%, in 2018-19 was 8%, and in 2019-20 was 5%.
The percentage of EL students with exclusionary discipline in 2017-18 was 13%, 2018-19 was 13%, and in 2019-20 was 9%; the non-EL students with exclusionary discipline in 2017-18 was 8%, in 2018-19 was 9%, and in 2019-20 was 5%; the gap between the two groups in 2017-18 was 5%, in 2018-19 was 4%, and in 2019-20 was 4%.
The percentage of special education students with exclusionary discipline in 2017-18 was 17%, in 2018-19 was 17%, and in 2019-20 was 9%; the non-special education students with exclusionary discipline in 2017-18 was 8%, in 2018-19 was 8%, and in 2019-20 was 5%; the gap between the two groups in 2017-18 was 9%, in 2018-19 was 9%, and in 2019-20 was 4%.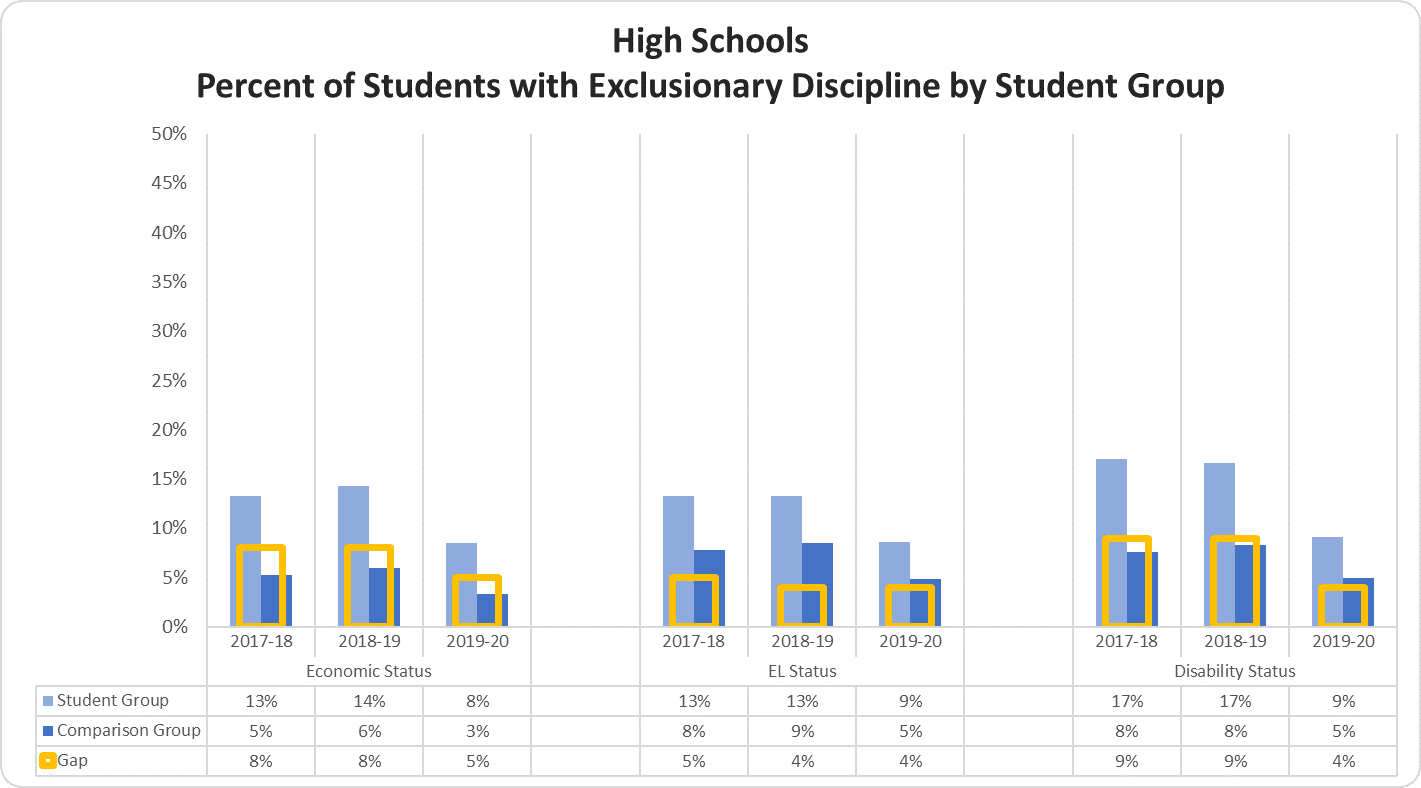
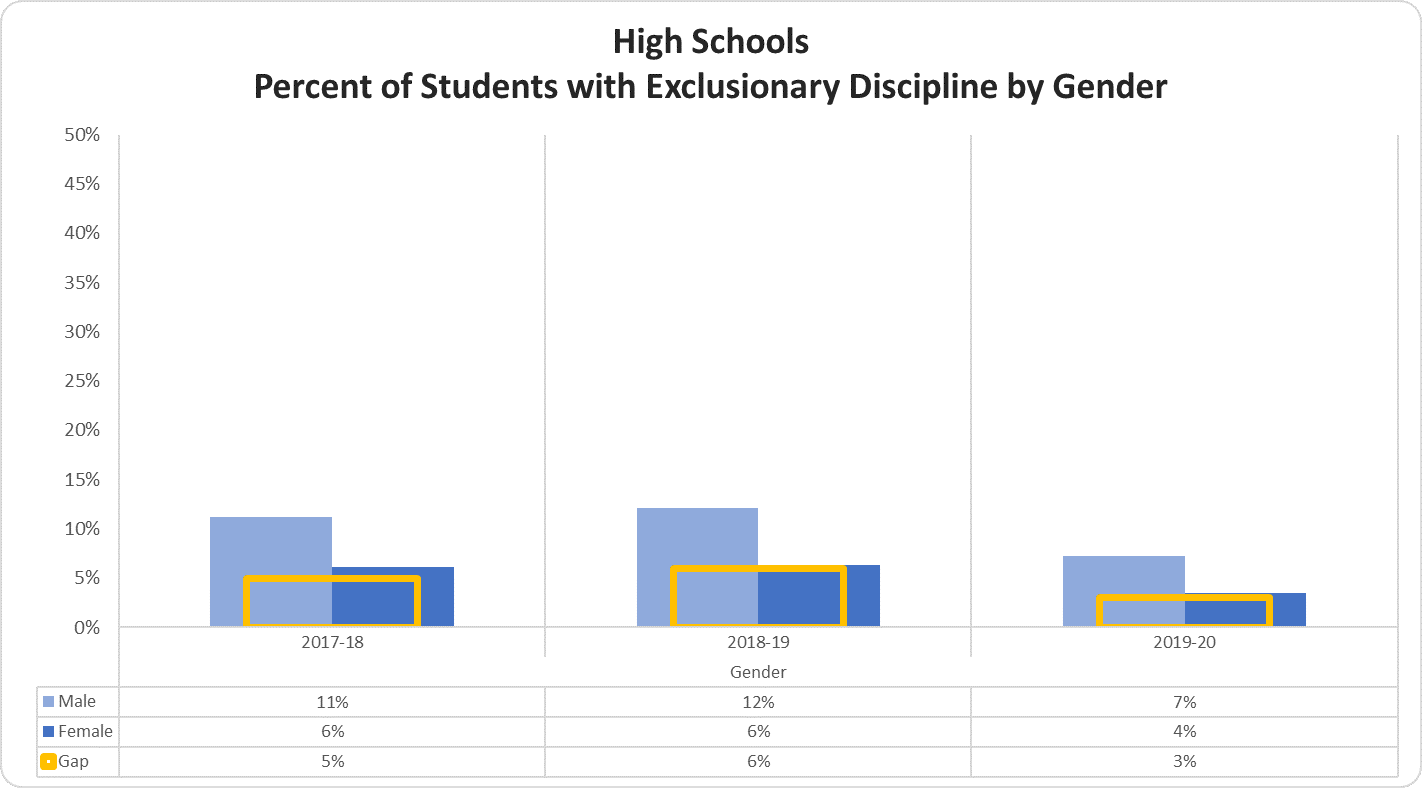
High Schools Percentage of Students with Exclusionary Discipline by Gender
The High Schools Percent of Students with Exclusionary Discipline by Gender graph displays the percentage of students with exclusionary discipline for the most recent three years.
The percentage of male students with exclusionary discipline in 2017-18 was 11%, in 2018-19 was 12%, and in 2019-20 was 7%; the female students with exclusionary discipline in 2017-18 was 6%, in 2018-19 was 6%, and in 2019-20 was 4%; the gap between the two groups in 2017-18 was 5%, in 2018-19 was 6%, and in 2019-20 was 3%.
Additional Learning Climate Measures
Percentage of Students Absent 10% or More of Membership Days by Ethnicity
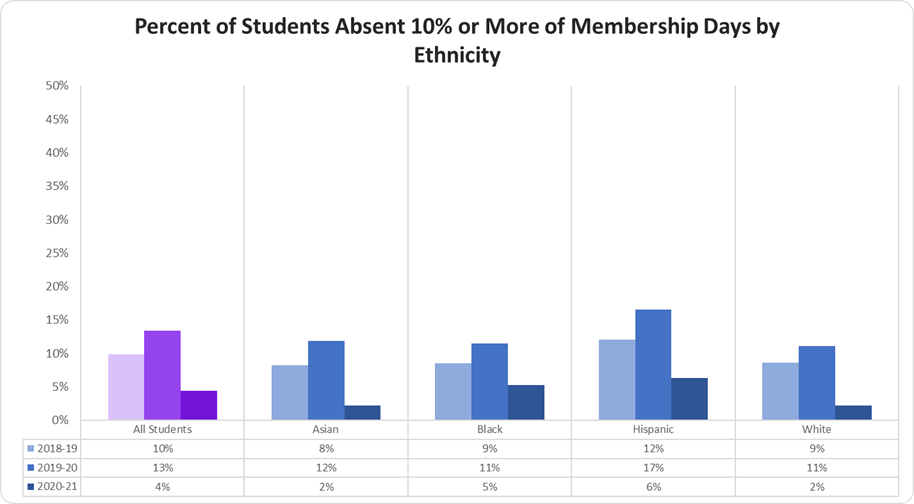
The Percent of Students Absent 10% or More of Membership Days by Ethnicity graph displays the percentage of students chronically absent for the three most recent years.
The percentage of all students chronically absent in 2018-19 was 10%, 2019-20 was 13%, and 2020-21 was 4%; the percentage of Asian students chronically absent in 2018-19 was 8%, 2019-20 was 12%, and 2020-21 was 2%; the percentage of Black students chronically absent in 2018-19 was 9%, 2019-20 was 11%, and 2020-21 was 5%; the percentage of Hispanic students chronically absent in 2018-19 was 12%, 2019-20 was 17%, and 2020-21 was 6%; the percentage of white students chronically absent in 2018-19 was 9%, 2019-20 was 11%, and 2020-21 was 2%.
Percentage of Students Absent 10% or More of Membership Days by Student Group
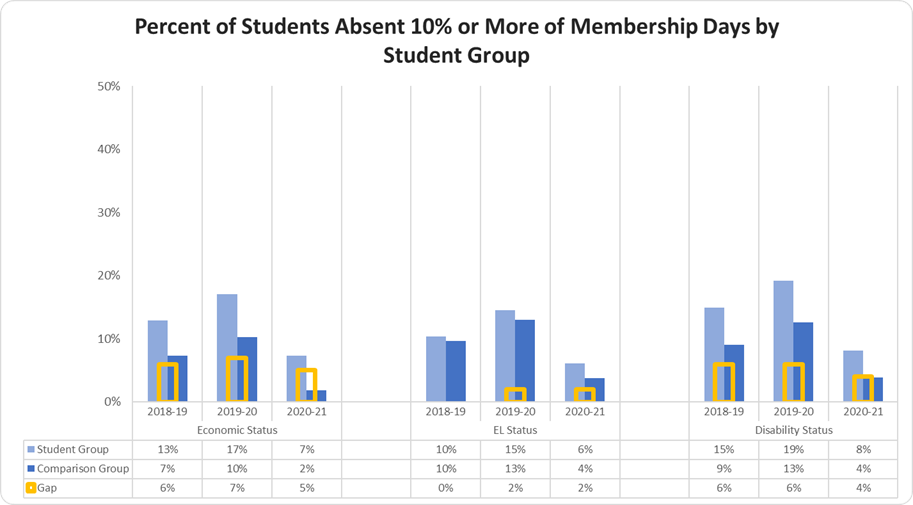
The Percent of Students Absent 10% or More of Membership Days by Student Group graph displays the percentage of students chronically absent for the three most recent years.
The percentage of economically disadvantaged students chronically absent in 2018-19 was 13%, 2019-20 was 17%, and 2020-21 was 7%; the percentage of non-economically disadvantaged students chronically absent in 2018-19 was 7%, 2019-20 was 10%, and 2020-21 was 2%; the gap between the two groups in 2018-19 was 6%, 2019-20 was 7%, and 2020-21 was 5%.
The percentage of EL students chronically absent in 2018-19 was 10%, 2019-20 was 15%, and 2020-21 was 6%; the percentage of non-EL students chronically absent in 2018-19 was 10%, 2019-20 was 13%, and 2020-21 was 4%; the gap between the two groups in 2018-19 was 0%, 2019-20 was 2%, and 2020-21 was 2%.
The percentage of students with disabilities chronically absent in 2018-19 was 15%, 2019-20 was 19%, and 2020-21 was 8%; the percentage of students without disabilities chronically absent in 2018-19 was 9%, 2019-20 was 13%, and 2020-21 was 4%; the gap between the two groups in 2019-19 was 6%, 2019-20 was 6%, and 2020-21 was 4%.
Teacher Quality State and Division
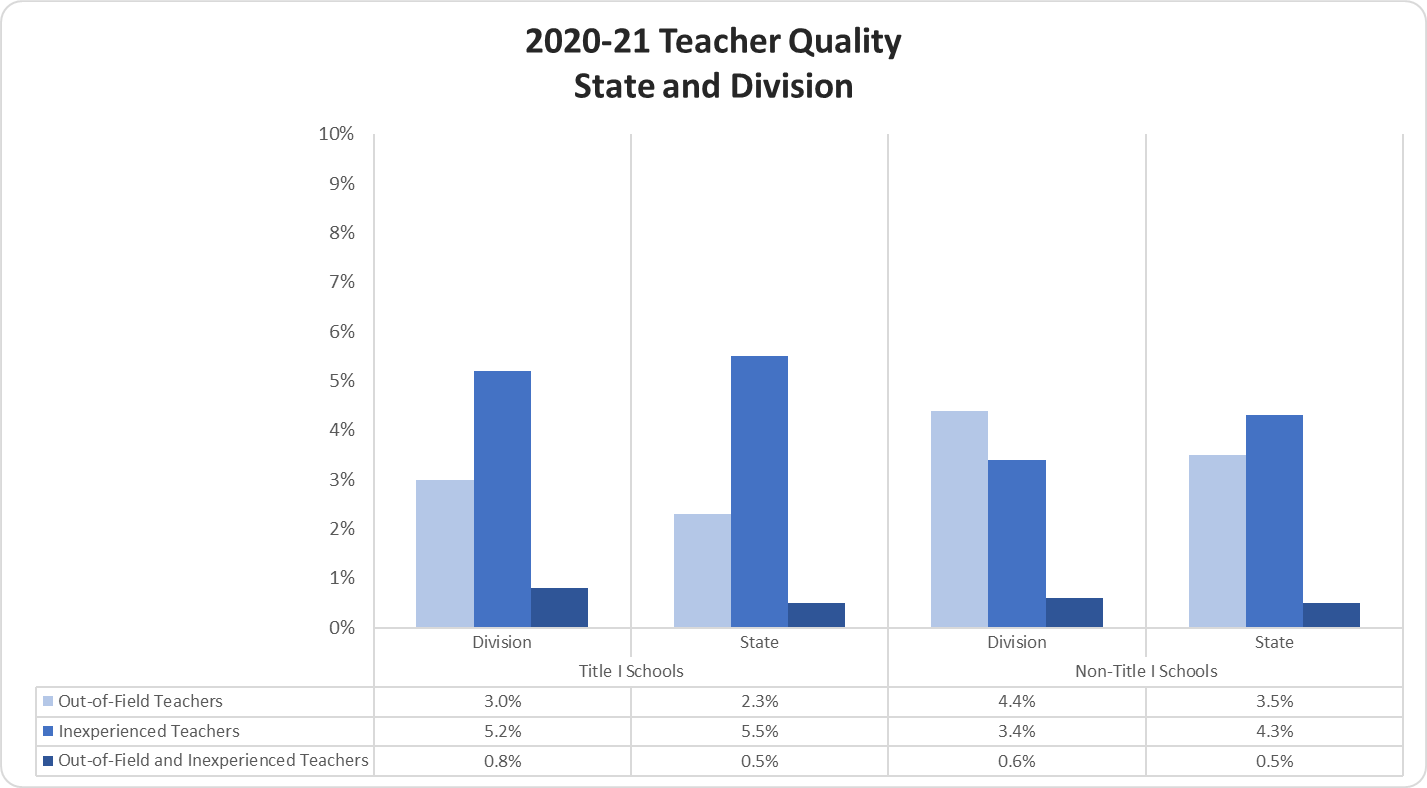
The 2020-21 Teacher Quality State and Division graph displays the percentage of Title l Schools and non-Title l schools for the 2020-21 school year.
The percentage of out-of-field teachers in Title l schools in the division was 3.0%, and in the state, it was 2.3%. The percentage of inexperienced teachers in the division was 5.2%, and in the state, it was 5.5%. The percentage of out-of-field and inexperienced teachers in the division was 0.8%, and in the state, it was 0.5%.
The percentage of out-of-field Teachers in non-Title l schools in the division was 4.4%, and in the state, it was 3.5%. The percentage of inexperienced teachers in the division was 3.4%, and in the state, it was 4.3%. The percentage of out-of-field and inexperienced Teachers in the division was 0.6%, and in the state, it was 0.5%.
Out-of-Field Teachers Teacher Quality State and Division
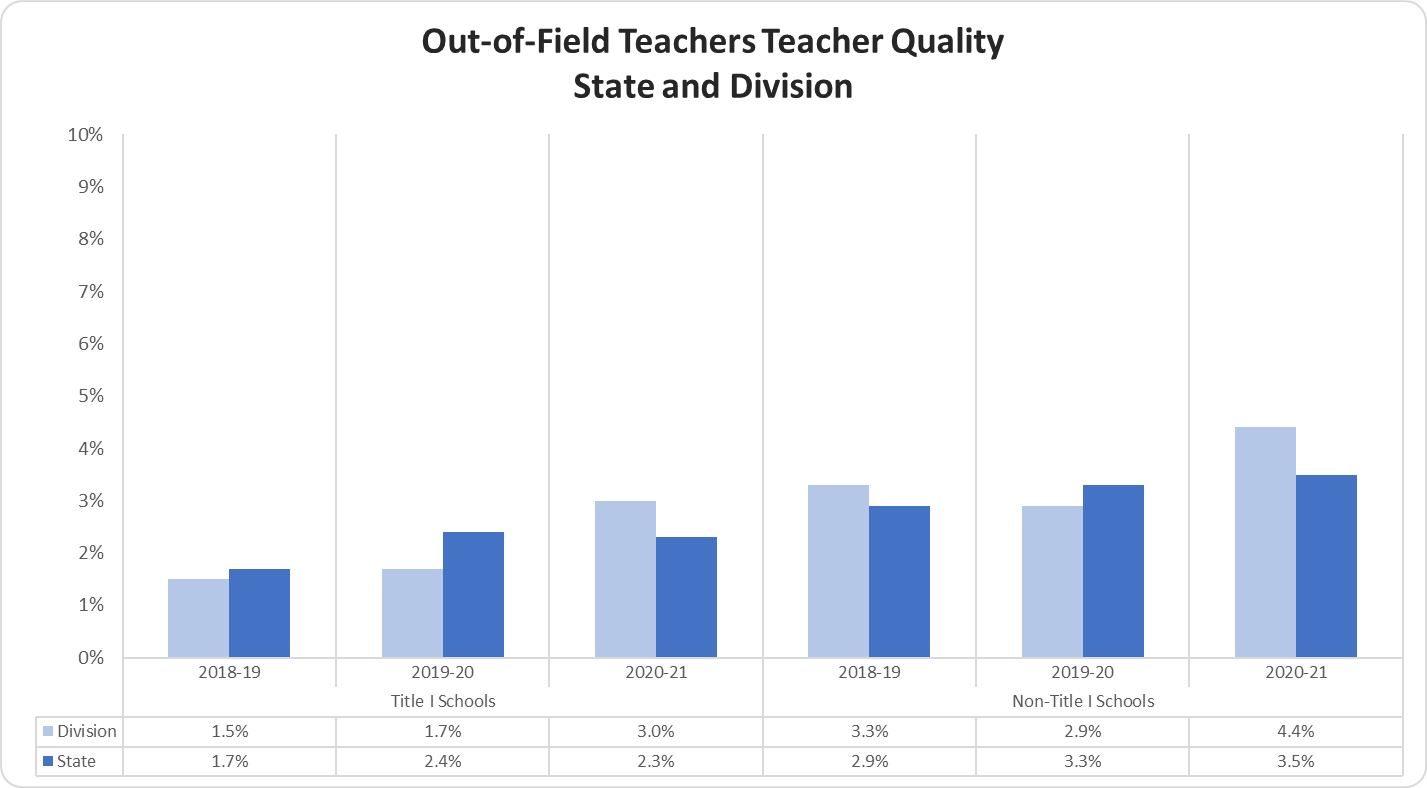
The Out-of-Field Teachers Teacher Quality State and Division graph displays the percentage of out-of-field teachers in Title I and non-Title I schools for the most recent three years.
The percentage of out-of-field teachers in Title l schools in the division in 2018-19 was 1.5%, 2019-20 was 1.7%, and 2020-21 was 3.0%. The percentage of out-of-field teachers in Title l schools in the state in 2018-19 was 1.7%, 2019-20 was 2.4%, and 2020-21 was 2.3%.
The percentage of out-of-field teachers in non-Title l schools in the division in 2018-19 was 3.3%, 2019-20 was 2.9%, and 2020-21 was 4.4%. The percentage of out-of-field teachers in non-Title l schools in the state in 2018-19 was 2.9%, 2019-20 was 3.3%, and 2020-21 was 3.5%.
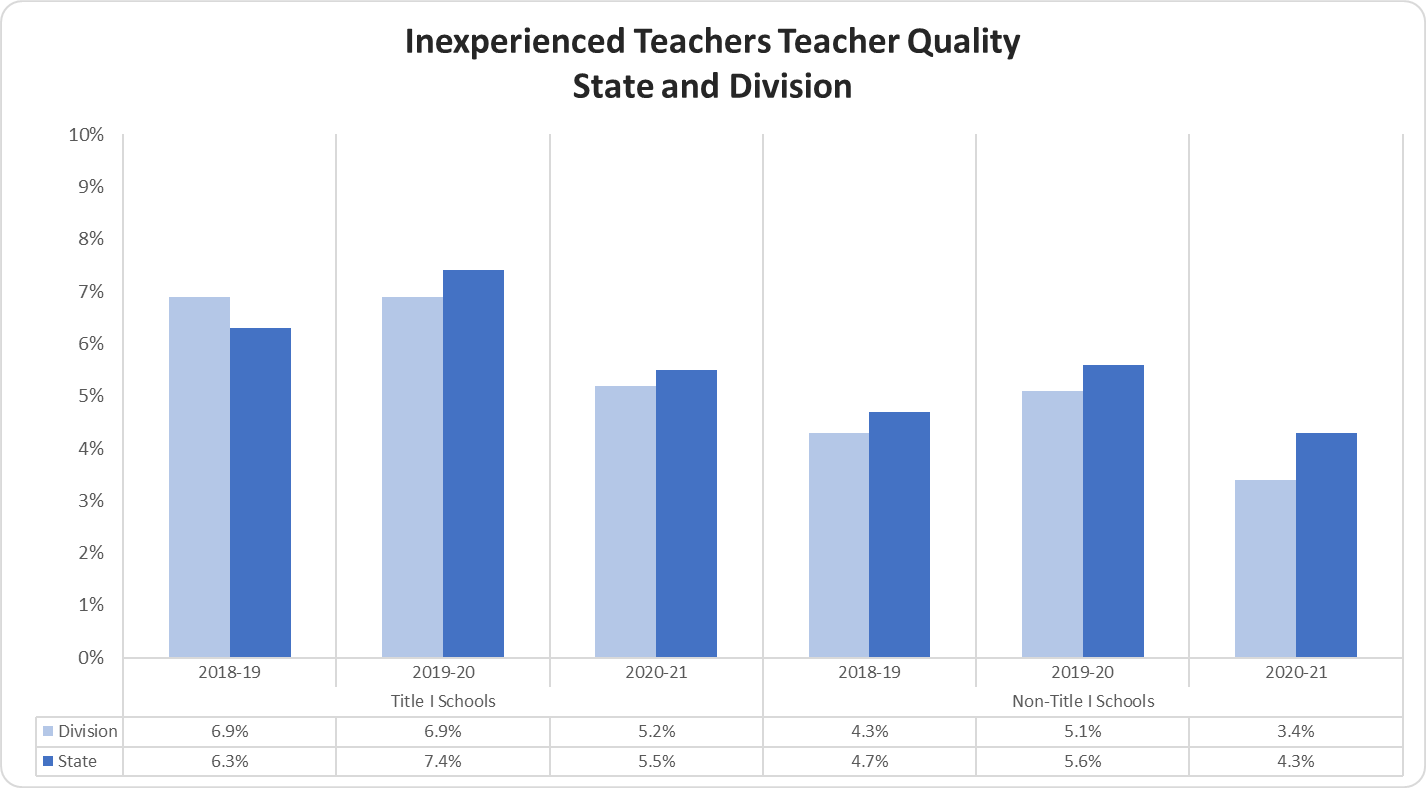
Inexperienced Teachers Teacher Quality State and Division
The Inexperienced Teachers Teacher Quality State and Division graph displays the percentage of inexperienced teachers in Title I and Non-Title I schools for the most recent three years.
The percentage of inexperienced teachers in Title l schools in the division in 2018-19 was 6.9%, 2019-20 was 6.9%, and 2020-21 was 5.2%. The percentage of inexperienced teachers in Title l schools in the state in 2018-19 was 6.3%, 2019-20 was 7.4%, and 2020-21 was 5.5%.
The percentage of inexperienced teachers in non-Title l schools in the division in 2018-19 was 4.3%, 2019-20 was 5.1%, and 2020-21 was 3.4%. The percentage of inexperienced teachers in non-Title l schools in the state in 2018-19 was 4.7%, 2019-20 was 5.6%, and 2020-21 was 4.3%.
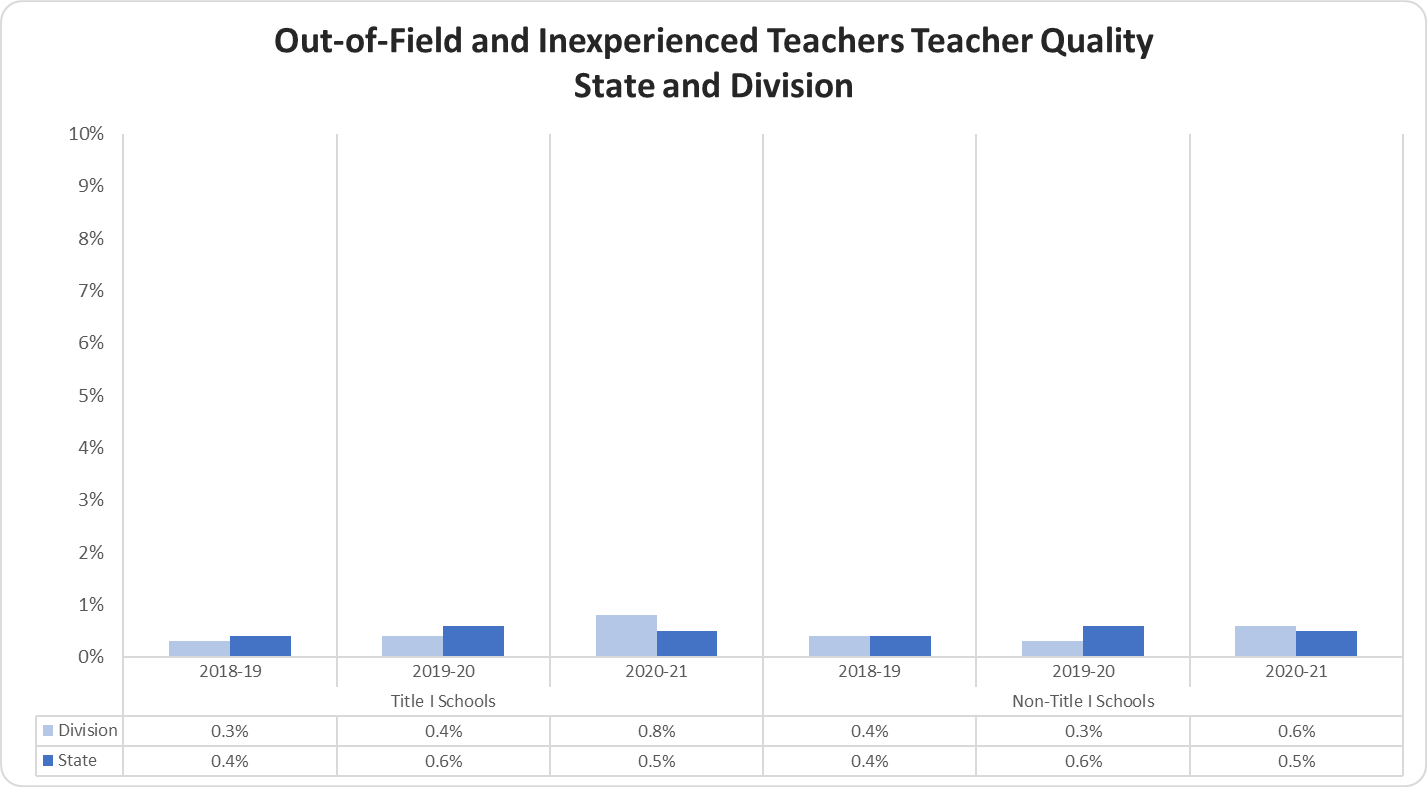
Out-of-Field and Inexperienced Teachers Teacher Quality State and Division
The Out-of-Field and Inexperienced Teachers Teacher Quality State and Division graph displays the percentage of out-of-field and inexperienced teachers in Title I and non-Title I schools for the most recent three years.
The percentage of out-of-field and inexperienced Teachers in Title l schools in the division in 2018-19 was 0.3%, 2019-20 was 0.4%, and 2020-21 was 0.8%. The percentage of out-of-field and inexperienced Teachers in Title l schools in the state in 2018-19 was 0.4%, 2019-20 was 0.6%, and 2020-21 was 0.5%.
The percentage of out-of-field and inexperienced Teachers in non-Title l schools in the division in 2018-19 was 0.4%, 2019-20 was 0.3%, and 2020-21 was 0.6%. The percentage of out-of-field and inexperienced Teachers in Non-Title l schools in the state in 2018-19 was 0.4%, 2019-20 was 0.6%, and 2020-21 was 0.5%.
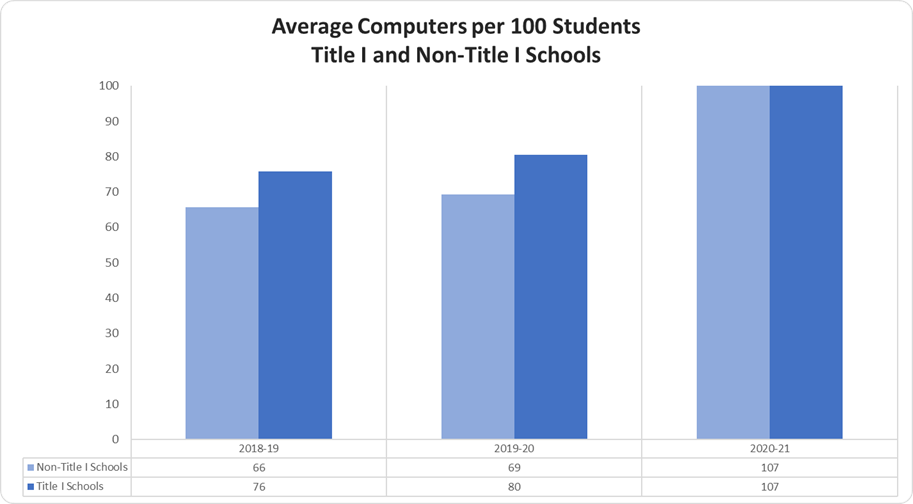
Average Computers per 100 Students Title I and Non-Title I Schools
The Average Computers per 100 Students Title I and Non-Title I Schools graph displays the average number of computers per 100 students for the most recent three years.
The average number of computers per 100 students for non-Title l Schools in 2018-19 was 66, 2019-20 was 69, and 2020-21 was 76; for Title l Schools in 2018-19 was 76, 2019-20 was 80, and 2020-21 was 83.
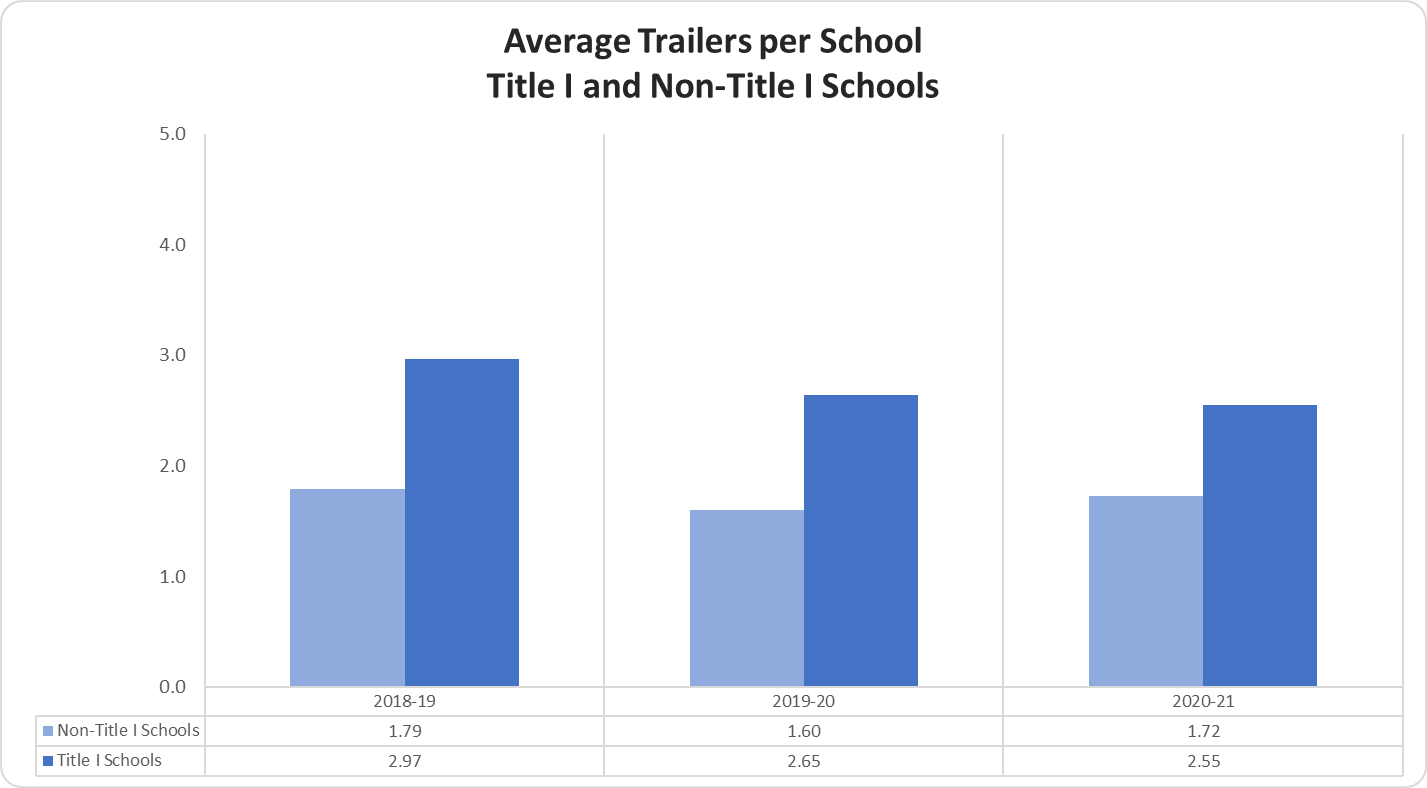
Average Trailers per School Title I and Non-Title I Schools
The Average Trailers per School Title I and Non-Title I Schools graph displays the average number of trailers per school for the most recent three years.
The average number of trailers per school for non-Title l schools in 2018-19 was 1.79%, 2019-20 was 1.60%, and 2020-21 was 1.72%; for Title l schools in 2018-19 was 2.97%, 2019-20 was 2.65%, and 2020-21 was 2.55%.
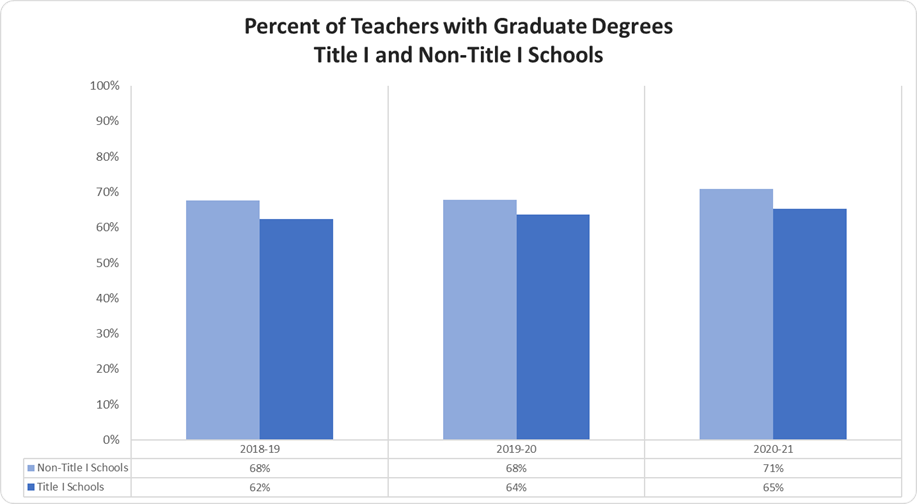
Percentage of Teachers with Graduate Degrees Title I and Non-Title I Schools
The Percent of Teachers with Graduate Degrees Title I and Non-Title I Schools graph displays the percentage of teachers with graduate degrees in Title I and non-Title I schools for the most recent three years.
The percent of teachers with graduate degrees for non-Title l Schools in 2018-19 was 68%, 2019-20 was 68%, and 2020-21 was 71%; for Title l Schools in 2018-19 was 62%, 2019-20 was 64%, and 2020-21 was 65%.
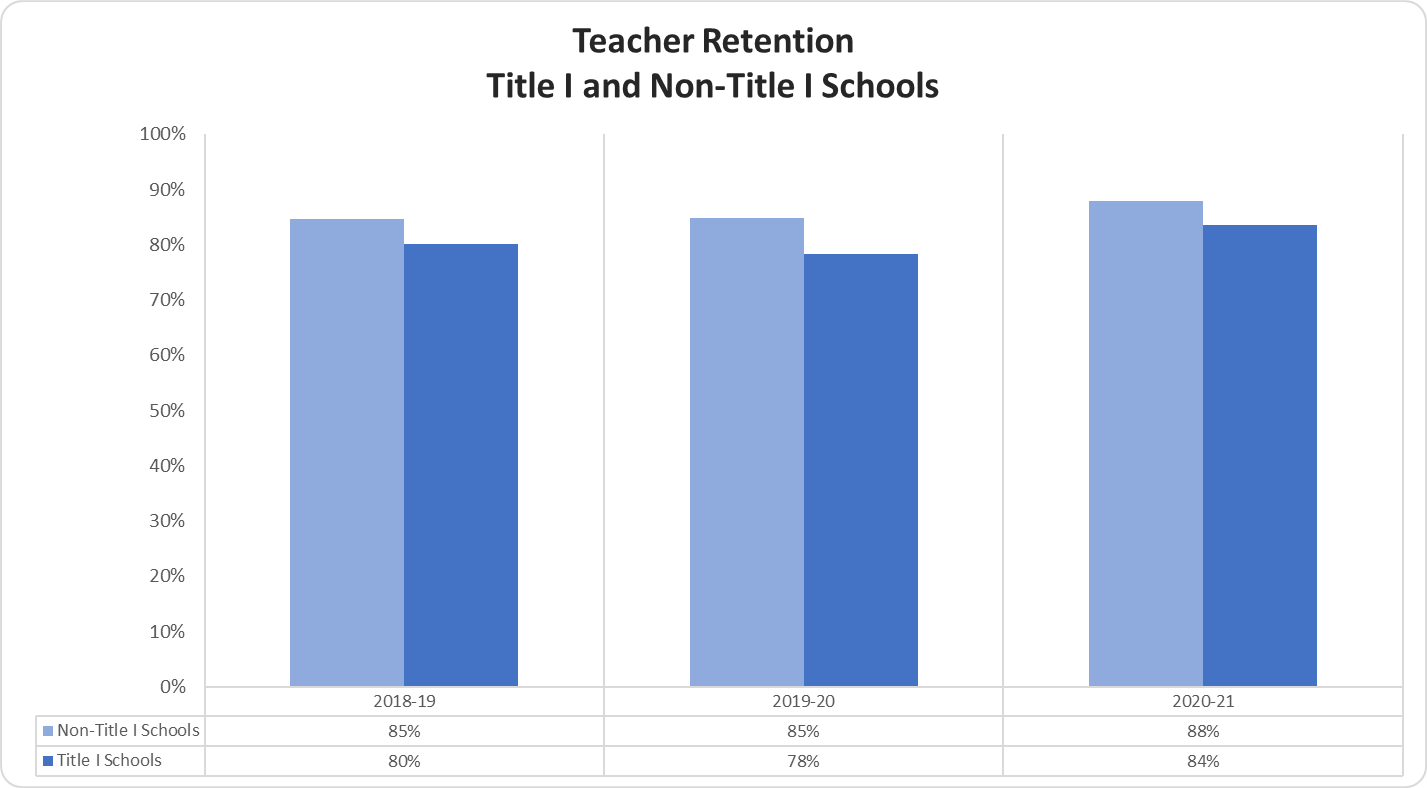
Teacher Retention Title I and Non-Title I Schools
The Teacher Retention Title I and Non-Title I Schools graph displays the percentage of teachers retained in Title I and Non-Title I schools for the most recent three years.
The percent of teachers retained for non-Title l Schools in 2018-19 was 85%, 2019-20 was 85%, and 2020-21 was 88%; for Title l Schools in 2018-19 was 80%, 2019-20 was 78%, and 2020-21 was 84%.
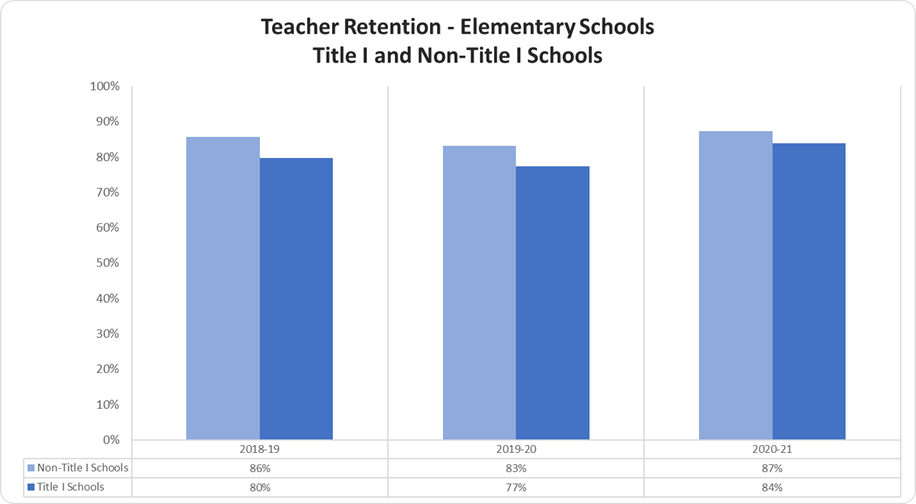
Elementary School Teacher Retention Title I and Non-Title I Schools
The Elementary School Teacher Retention Title I and Non-Title I Schools graph displays the percentage of teachers retained in Elementary Title I and non-Title I schools for the most recent three years.
The percent of teachers retained for elementary non-Title I schools in 2018-19 was 86%, 2019-20 was 83%, and 2020-21 was 87%; for elementary Title l schools in 2018-19 was 80%, 2019-20 was 77%, and 2020-21 was 84%.
