It is critical to examine the patterns of program access by student group, as well as patterns of identification for gifted programs and special education services. The data shown on this page include the participation of students in gifted programs, as well as the participation of students in advanced and career and technical education (CTE) courses at high school. It also includes charts showing the identification of students for special education. Gifted participation is shown annually and in five-year increments. Many of the charts on this page include comparisons by gender.
Elementary
Elementary Schools Gifted Program Participation by Ethnicity
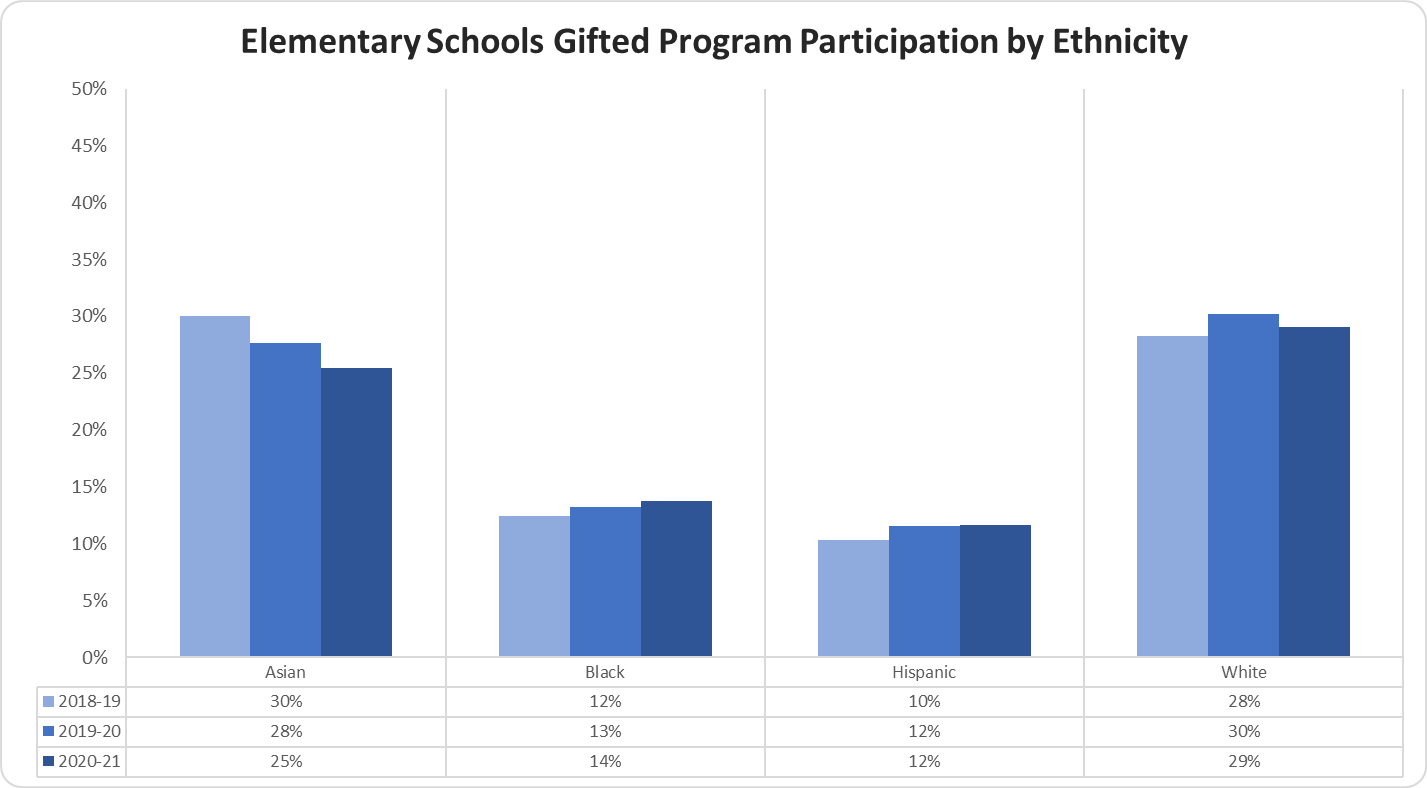
The Elementary Schools Gifted Program Participation by Ethnicity graph displays the percentage of students that participated in the Gifted Program for the most recent three years.
The percentage of Asian students that participated in 2018-19 was 30%, 2019-20 was 28%, and 2020-21 was 25%; the percentage of Black students that participated in 2018-19 was 12%, 2019-20 was 13%, and 2020-21 was 14%; the percentage of Hispanic students that participated in 2018-19 was 10%, 2019-20 was 12%, and 2020-21 was 12%; the percentage of White students that participated in 2018-19 was 28%, 2019-20 was 30%, and 2020-21 was 29%.
Elementary Schools Gifted Program Participation by Student Group
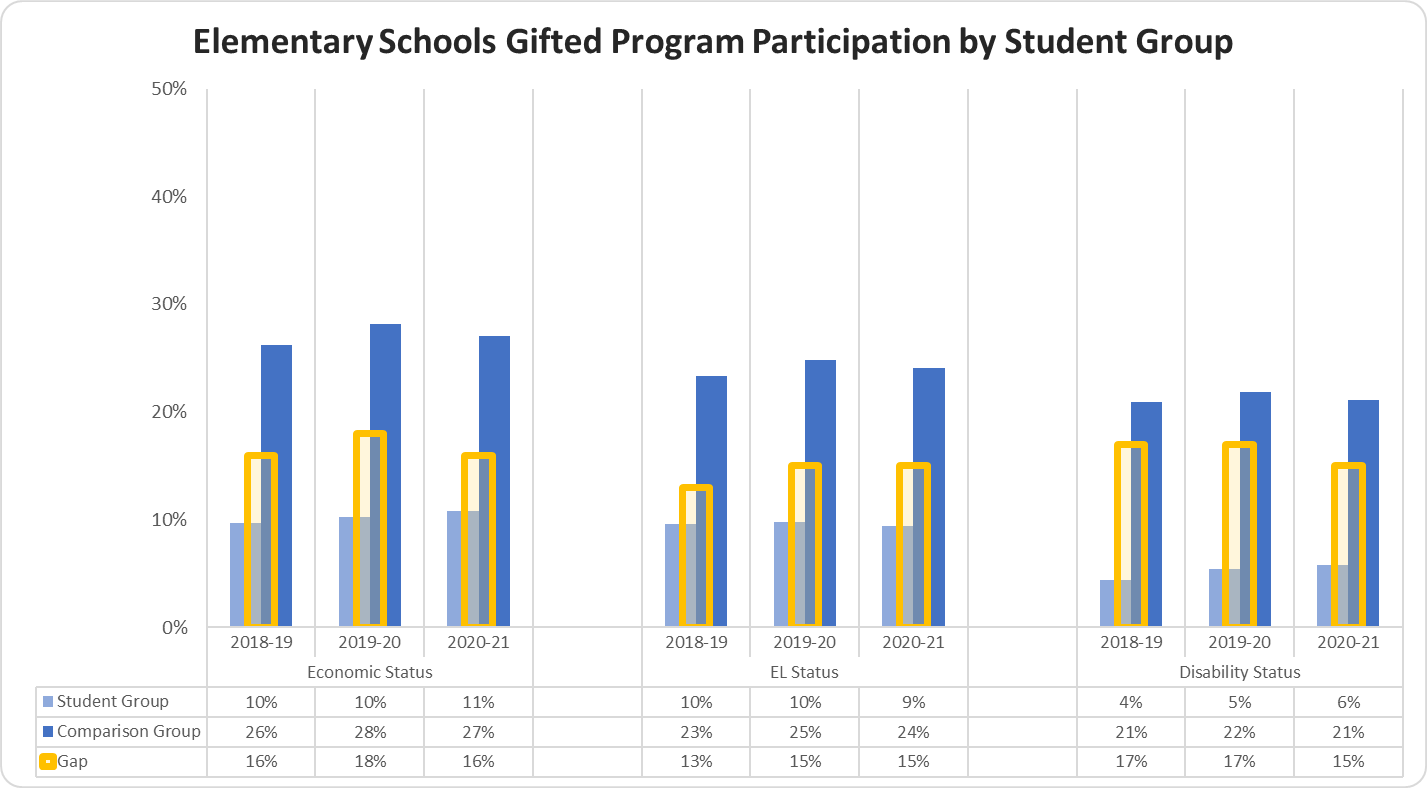
The Elementary Schools Gifted Program Participation by Student Group graph displays the percentage of students that participated for the most recent three years.
The percentage of Economically Disadvantaged students that participated in 2018-19 was 10%, 2019-20 was 10%, and 2020-21 was 11%; the Non-Economically Disadvantaged students that participated in 2018-19 was 26%, 2019-20 was 28%, and 2020-21 was 27%; the gap between the two groups in 2018-19 was 16%, 2019-20 was 18%, and 2020-21 was 16%.
The percentage of EL students that participated in 2018-19 was 10%, 2019-20 was 10%, and 2020-21 was 9%; the Non-EL students that participated in 2018-19 was 23%, in 2019-20 was 25%, and 2020-21 was 24%; the gap between the two groups in 2018-19 was 13%, 2019-20 was 15%, and 2020-21 was 15%.
The percentage of Students with Disabilities that participated in 2018-19 was 4%, 2019-20 was 5%, and in 2020-21 was 6%; the Students without Disabilities that participated in 2018-19 was 21%, 2019-20 was 22%, and 2020-21 was 21%; the gap between the two groups in 2018-19 was 17%, 2019-20 was 17%, and 2020-21 was 15%.
Elementary Schools Gifted Program Participation by Gender
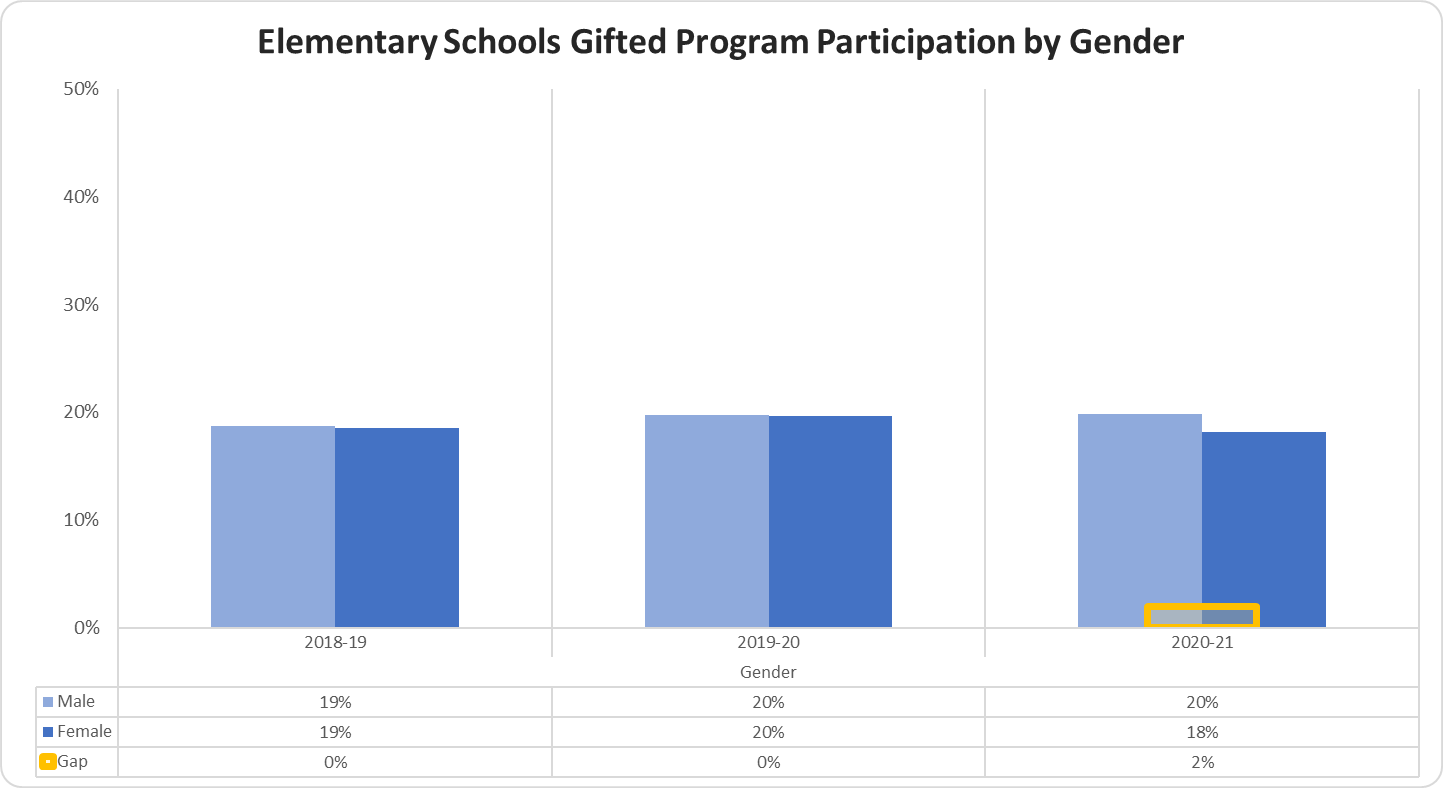
The Elementary Schools Gifted Program Participation by Gender graph displays the percentage of students that participated for the most recent three years.
The percentage of Male students that participated in 2018-19 was 19%, 2019-20 was 20%, and 2020-21 was 20%; the Female students that participated in 2018-19 was 19%, 2019-20 was 20%, and 2020-21 was 18%; the gap between the two groups in 2018-19 was 0%, 2019-20 was 0%, and 2020-21 was 2%.
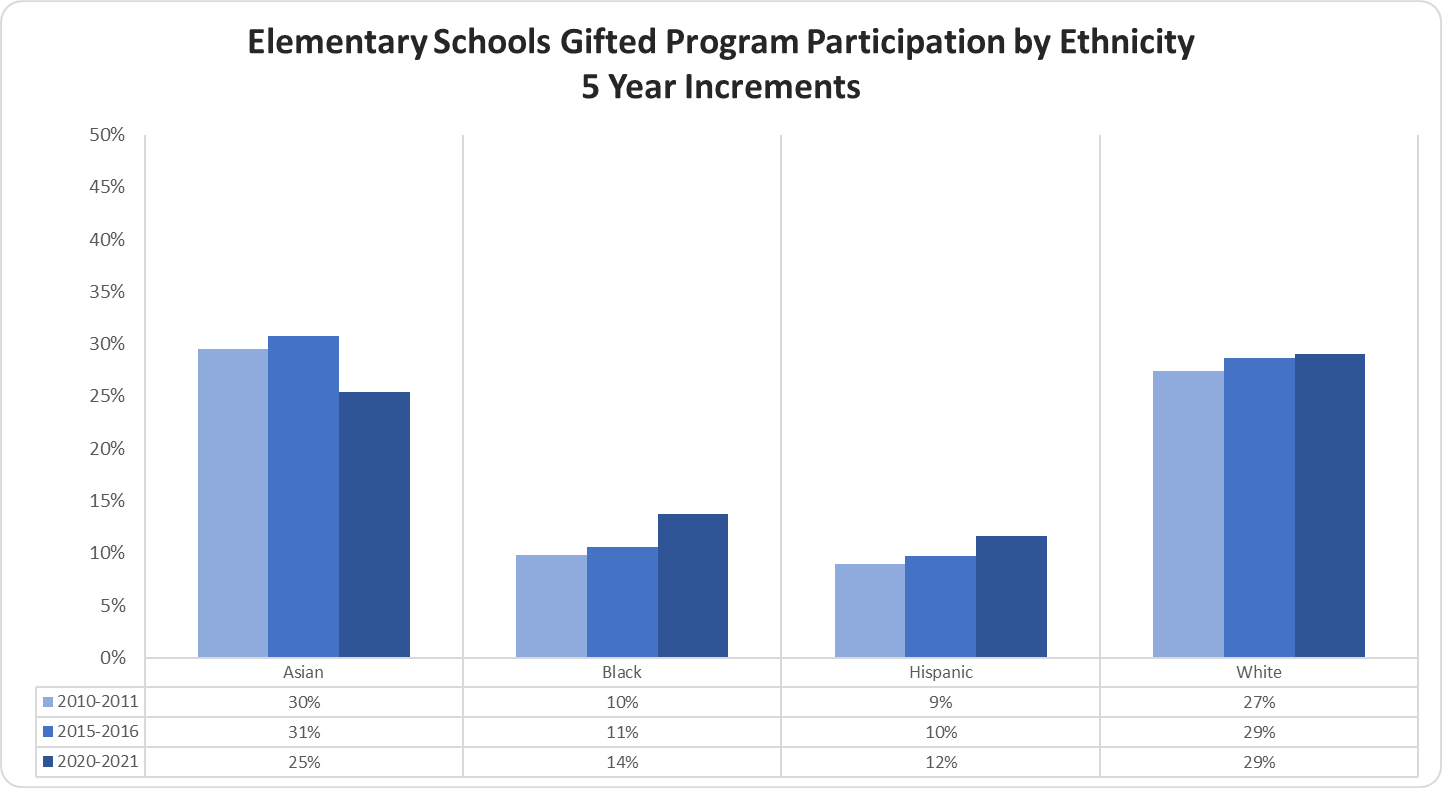
Elementary Schools Gifted Program Participation by Ethnicity in Five Year Increments
The Elementary Schools Gifted Program Participation by Ethnicity in Five-Year Increments graph displays the percentage of students that participated for the most recent five-year increments.
The percentage of Asian students that participated in 2010-11 was 30%, in 2015-16 was 31%, and 2020-21 was 25%; the percentage of black students that participated in 2010-11 was 10%, 2015-16 was 11%, and 2020-21 was 14%; the percentage of Hispanic students that participated in 2010-11 was 9%, 2015-16 was 10%, and 2020-21 was 12%; the percentage of White students that participated in 2010-11 was 27%, 2015-16 was 29%, and 2020-21 was 29%.
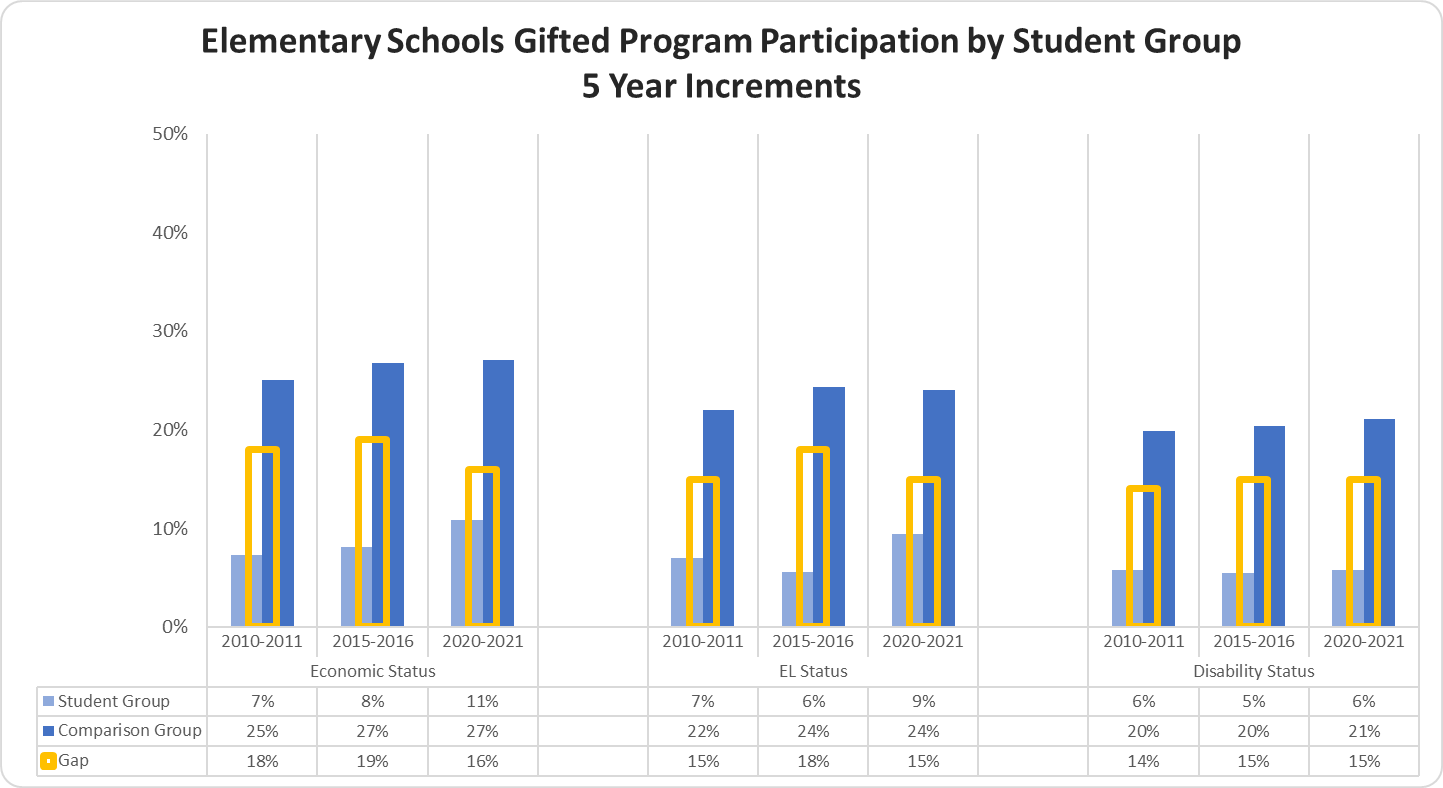
Elementary Schools Gifted Program Participation by Student Group in Five Year Increments
The Elementary Schools Gifted Program Participation by Student Group in Five-Year Increments graph displays the percentage of students that participated for the most recent five-year increments.
The percentage of Economically Disadvantaged students that participated in 2010-11 was 7%, 2015-16 was 8%, and 2020-21 was 11%; the percentage of Non-Economically Disadvantaged students that participated in 2010-11 was 25%, 2015-16 was 27%, and 2020-21 was 27%; the gap between the two groups in 2010-11 was 18%, 2015-16 was 19%, and 2020-21 was 16%.
The percentage of EL students that participated in 2010-11 was 7%, 2015-16 was 6%, and 2020-21 was 9%; the percentage of non-EL students that participated in 2010-11 was 22%, 2015-16 was 24%, and 2020-21 was 24%; the gap between the two groups in 2010-11 was 15%, 2015-16 was 18%, and 2020-21 was 15%.
The percentage of Students with Disabilities that participated in 2010-11 was 6%, 2015-16 was 5%, and 2020-21 was 6%; the percentage of Students without Disabilities that participated in 2010-11 was 20%, 2015-16 was 20%, and 2020-21 was 21%; the gap between the two groups in 2010-11 was 14%, 2015-16 was 15%, and 2020-21 was 15%.
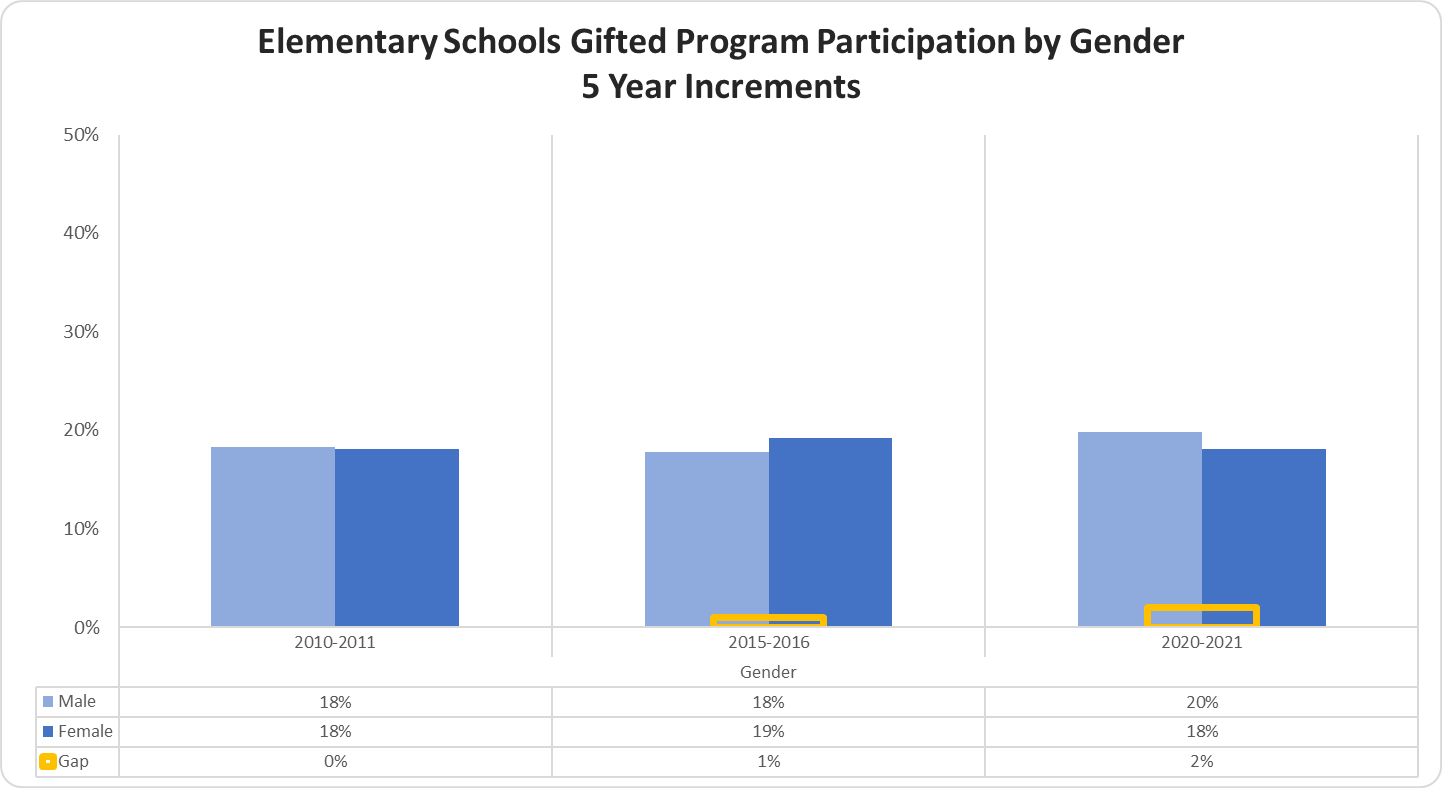
Elementary Schools Gifted Program Participation by Gender in Five Year Increments
The Elementary Schools Gifted Program Participation by Gender in Five-Year Increments graph displays the percentage of students that participated for the most recent five-year increments.
The percentage of Male students that participated in 2010-11 was 18%, 2015-16 was 18%, and 2020-21 was 20%; the percentage of Female students that participated in 2010-11 was 18%, 2015-16 was 19%; and 2020-21 was 18%; the gap between the two groups in 2010-11 was 0%, 2015-16 was 1%, and 2020-21 was 2%.
Middle School
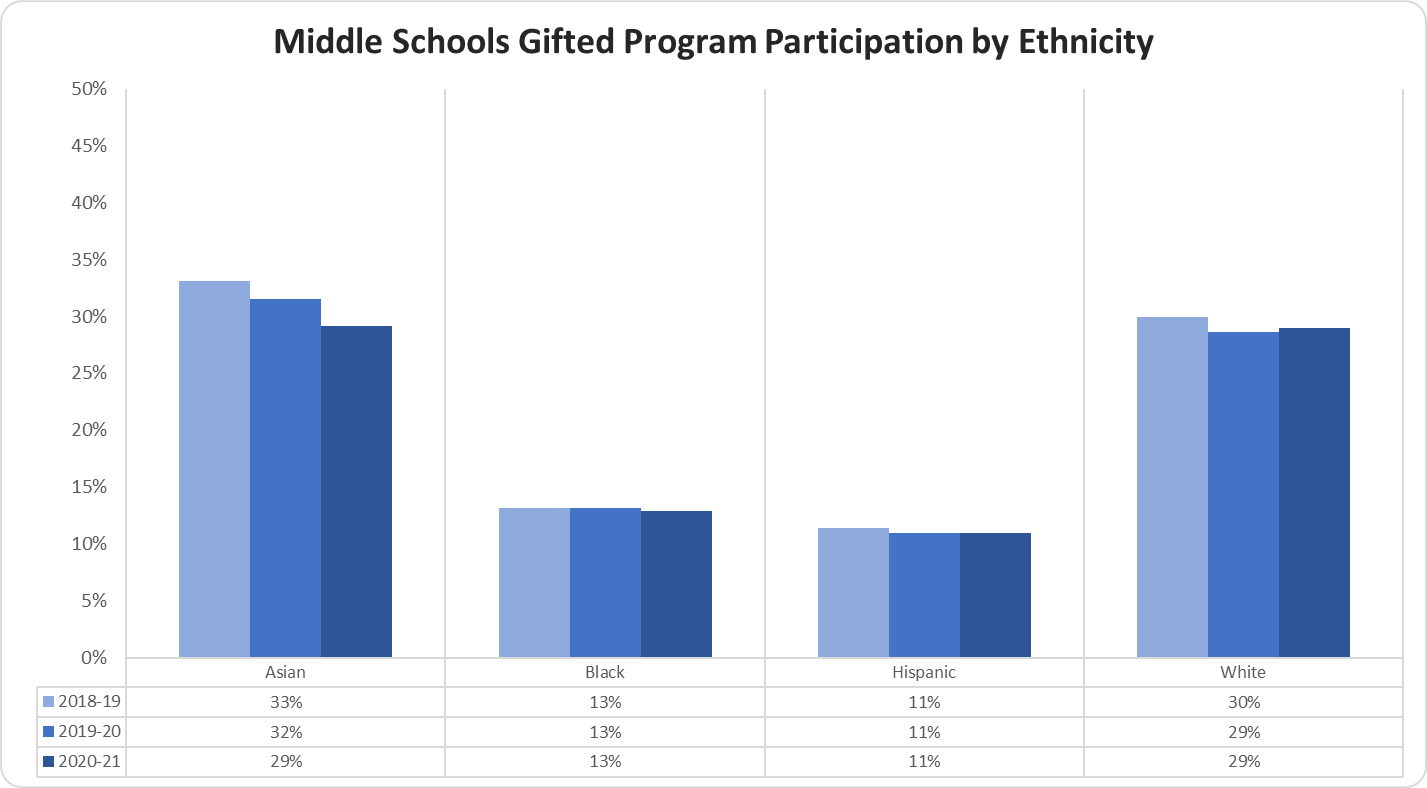
Middle Schools Gifted Program Participation by Ethnicity
The Middle Schools Gifted Program Participation by Ethnicity graph displays the percentage of students that participated in the gifted program for the most recent three years.
The percentage of Asian students that participated in 2018-19 was 33%, 2019-20 was 32%, and 2020-21 was 29%; the percentage of Black students that participated in 2018-19 was 13%, 2019-20 was 13%, and 2020-21 was 13%; the percentage of Hispanic students that participated in 2018-19 was 11%, 2019-20 was 11%, and 2020-21 was 11%; the percentage of White students that participated in 2018-19 was 30%, 2019-20 was 29%, and 2020-21 was 29%.
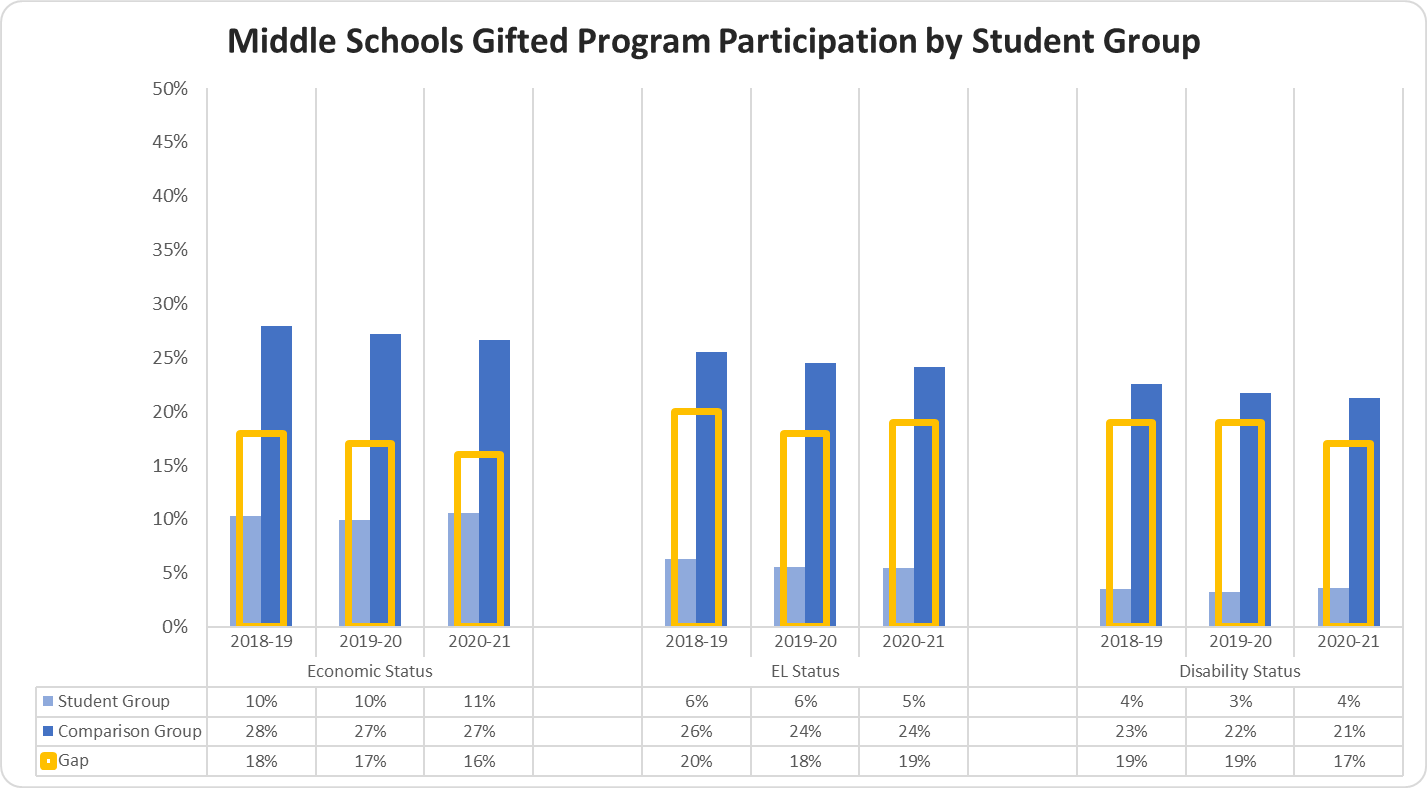
Middle Schools Gifted Program Participation by Student Group
The Middle Schools Gifted Program Participation by Student Group graph displays the percentage of students that participated for the most recent three years.
The percentage of Economically Disadvantaged students that participated in 2018-19 was 10%, 2019-20 was 10%, and 2020-21 was 11%; the Non-Economically Disadvantaged students that participated in 2018-19 was 28%, 2019-20 was 27%, and 2020-21 was 27%; the gap between the two groups in 2018-19 was 18%, 2019-20 was 17%, and 2020-21 was 16%.
The percentage of EL students that participated in 2018-19 was 6%, 2019-20 was 6%, and 2020-21 was 5%; the Non-EL students that participated in 2018-19 was 26%, 2019-20 was 24%, and 2020-21 was 24%; the gap between the two groups in 2018-19 was 20%, 2019-20 was 18%, and 2020-21 was 19%.
The percentage of Students with Disabilities that participated in 2018-19 was 4%, 2019-20 was 3%, and 2020-21 was 4%; the percentage of Students without Disabilities that participated in 2018-19 was 23%, 2019-20 was 22%, and 2020-21 was 21%; the gap between the two groups in 2018-19 was 19%, 2019-20 was 19%, and 2020-21 was 17%.
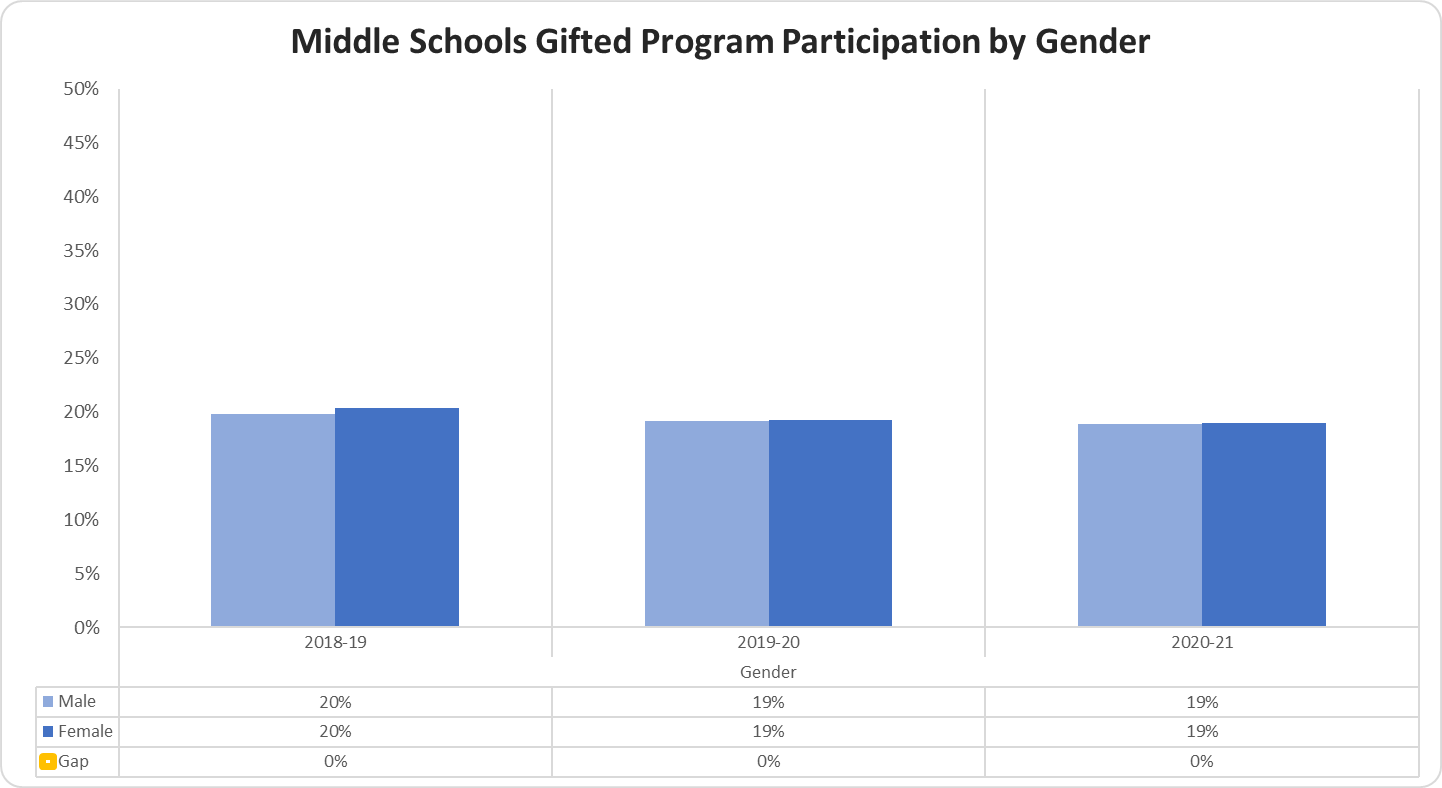
Middle Schools Gifted Program Participation by Gender
The Middle Schools Gifted Program Participation by Gender graph displays the percentage of students that participated for the most recent three years.
The percentage of Male students that participated in 2018-19 was 20%, 2019-20 was 19%, and 2020-21 was 19%; the percentage of Female students that participated in 2018-19 was 20%, 2019-20 was 19%, and 2020-21 was 19%; the gap between the two groups in 2018-19 was 0%, 2019-20 was 0%, and 2020-21 was 0%.
High School
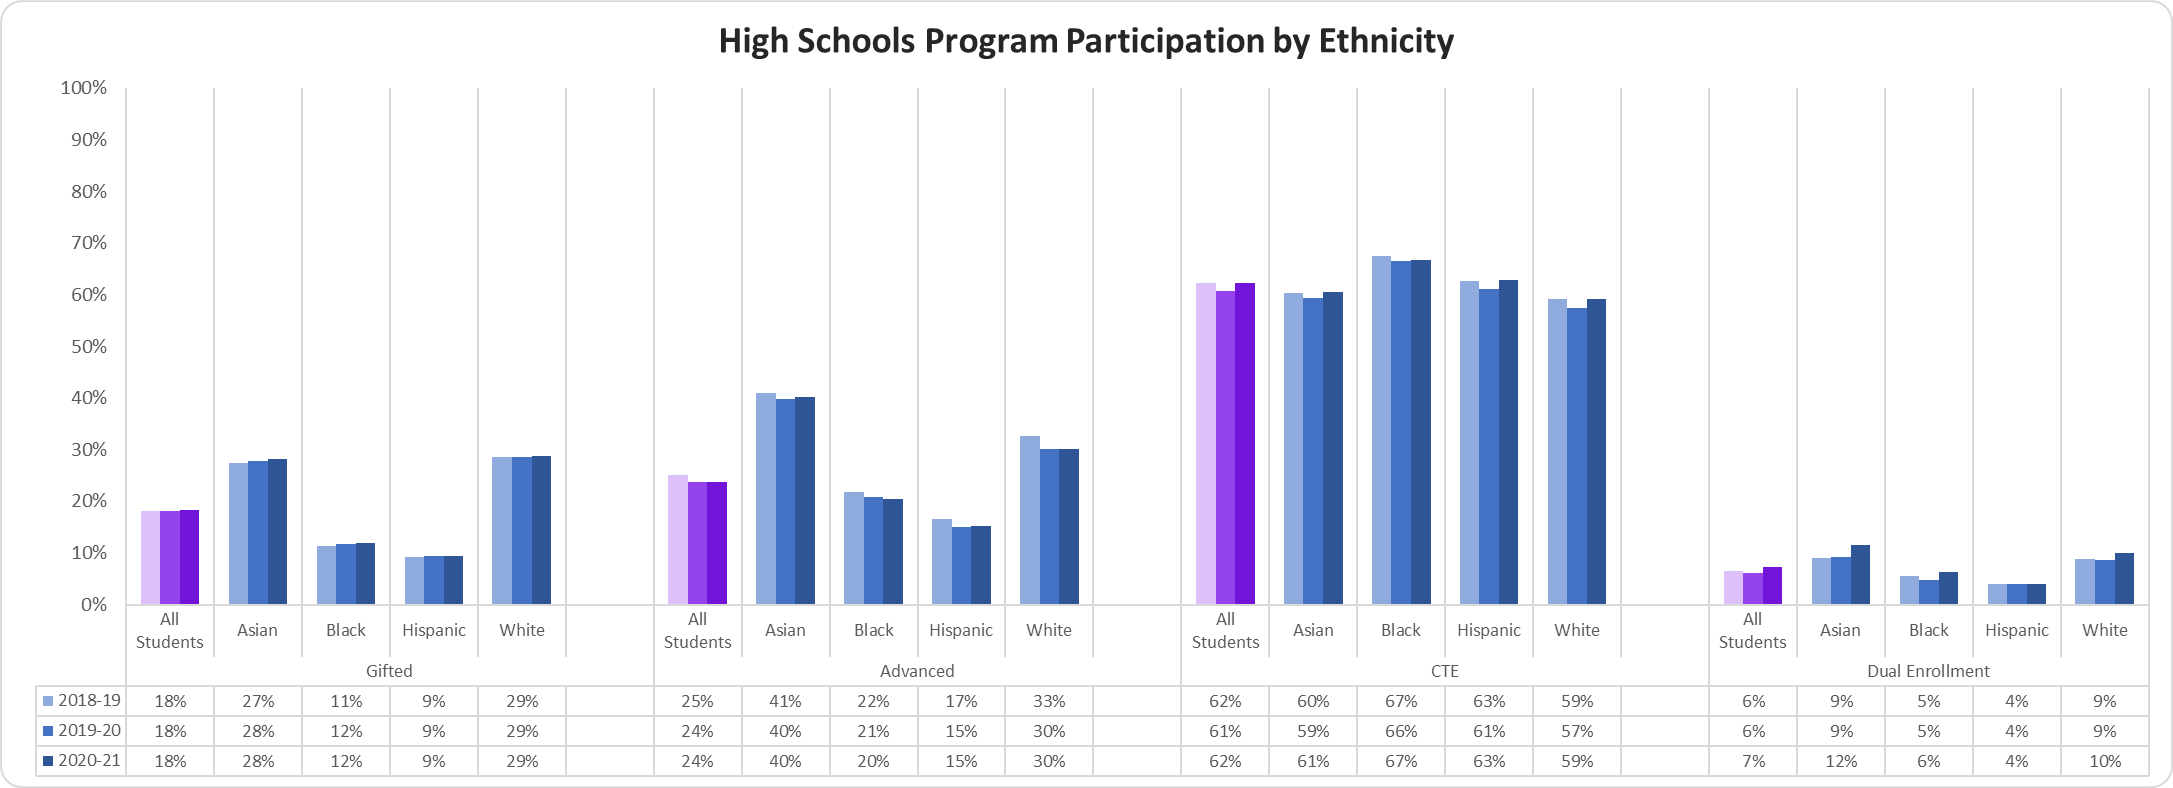
High Schools Program Participation by Ethnicity
The High Schools Program Participation by Ethnicity graph displays the percentage by ethnicity of each program (gifted, advanced, CTE, and Dual Enrollment) for the most recent three years.
In gifted, the percentage of All Students that participated in 2018-19 was 18%, 2019-20 was 18%, and 2020-21 was 18%; the percentage of Asian students that participated in 2018-19 was 27%, 2019-20 was 28%, and 2020-21 was 28%; the percentage of Black students that participated in 2018-19 was 11%, 2019-20 was 12%, and 2020-21 was 12%; the percentage of Hispanic students that participated in 2018-19 was 9%, 2019-20 was 9%, and 2020-21 was 9%; the percentage of White students that participated in 2018-19 was 29%, 2019-20 was 29%, and 2020-21 was 29%.
In advanced, the percentage of All Students that participated in 2018-19 was 25%, 2019-20 was 24%, and 2020-21 was 24%; the percentage of Asian students that participated in 2018-19 was 41%, 2019-20 was 40%, and 2020-21 was 40%; the percentage of Black students that participated in 2018-19 was 22%, 2019-20 was 21%, and 2020-21 was 20%; the percentage of Hispanic students that participated in 2018-19 was 17%, 2019-20 was 15%, 2020-21 was 15%; the percentage of White students that participated in 2018-19 was 33%, 2019-20 was 30%, and 2020-21 was 30%.
In CTE, the percentage of All students that participated in 2018-19 was 62%, 2019-20 was 61%, and 2020-21 was 62%; the percentage of Asian students that participated in 2018-19 was 60%, 2019-20 was 59%, and 2020-21 was 61%; the percentage of Black students that participated in 2018-19 was 67%, 2019-20 was 66%, and 2020-21 was 67%; the percentage of Hispanic students that participated in 2018-19 was 63%, 2019-20 was 61%, and 2020-21 was 63%; the percentage of White students that participated in 2018-19 was 59%, 2019-20 was 57%, and 2020-21 was 59%.
In Dual Enrollment, the percentage of All Students that participated in 2018-19 was 6%, 2019-20 was 6%, and 2020-21 was 7%; the percentage of Asian students that participated in 2018-19 was 9%, 2019-20 was 9%, and 2020-21 was 12%; the percentage of Black students that participated in 2018-19 was 5%, 2019-20 was 5%, and 2020-21 was 6%; the percentage of Hispanic students that participated in 2018-19 was 4%, 2019-20 was 4%, and 2020-21 was 4%; the percentage of White students that participated in 2018-19 was 9%, 2019-20 was 9%, and 2020-21 was 10%.
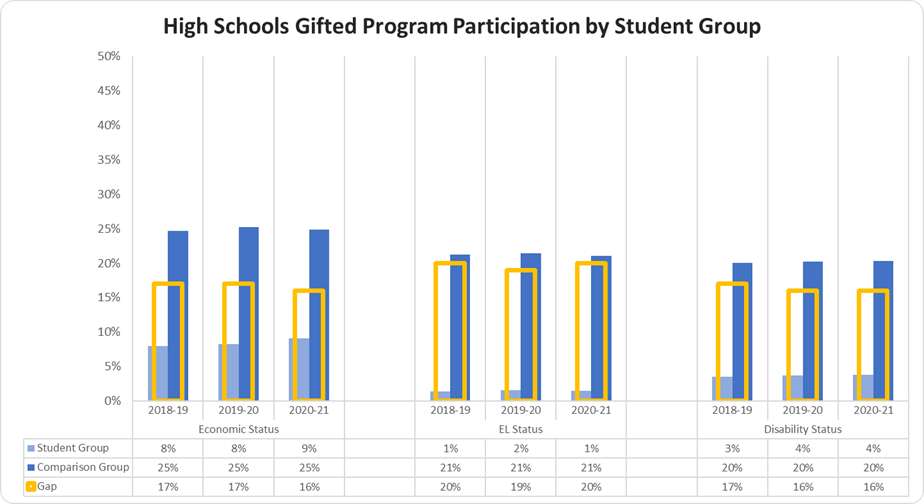
High Schools Gifted Program Participation by Student Group
The High Schools Gifted Program Participation by Student Group graph displays the percentage of students that participated for the most recent three years.
The percentage of Economically Disadvantaged students that participated in 2018-19 was 8%, in 2019-20 was 8%, and in 2019-20 was 9%; the percentage of Non-Economically Disadvantaged students that participated in 2018-19 was 25%, in 2019-20 was 25%, and in 2020-21 was 25%; the gap between the two groups in 2018-19 was 17%, 2019-20 was 17%, and in 2020-21 was 16%.
The percentage of EL students that participated in 2018-19 was 1%, 2019-20 was 2%, and 2020-21 was 1%; the percentage of Non-EL students that participated in 2018-19 was 21%, 2019-20 was 21%, and 2020-21 was 21%; the gap between the two groups in 2018-19 was 20%, 2019-20 was 19%, and 2020-21 was 20%.
The percentage of Students with Disabilities that participated in 2018-19 was 3%, 2019-20 was 4%, and 2020-21 was 4%; the percentage of Students without Disabilities that participated in 2018-19 was 20%, 2019-20 was 20%, and 2020-21 was 20%; the gap between the two groups in 2018-19 was 17%, in 2019-20 was 16%, and in 2020-21 was 16%.
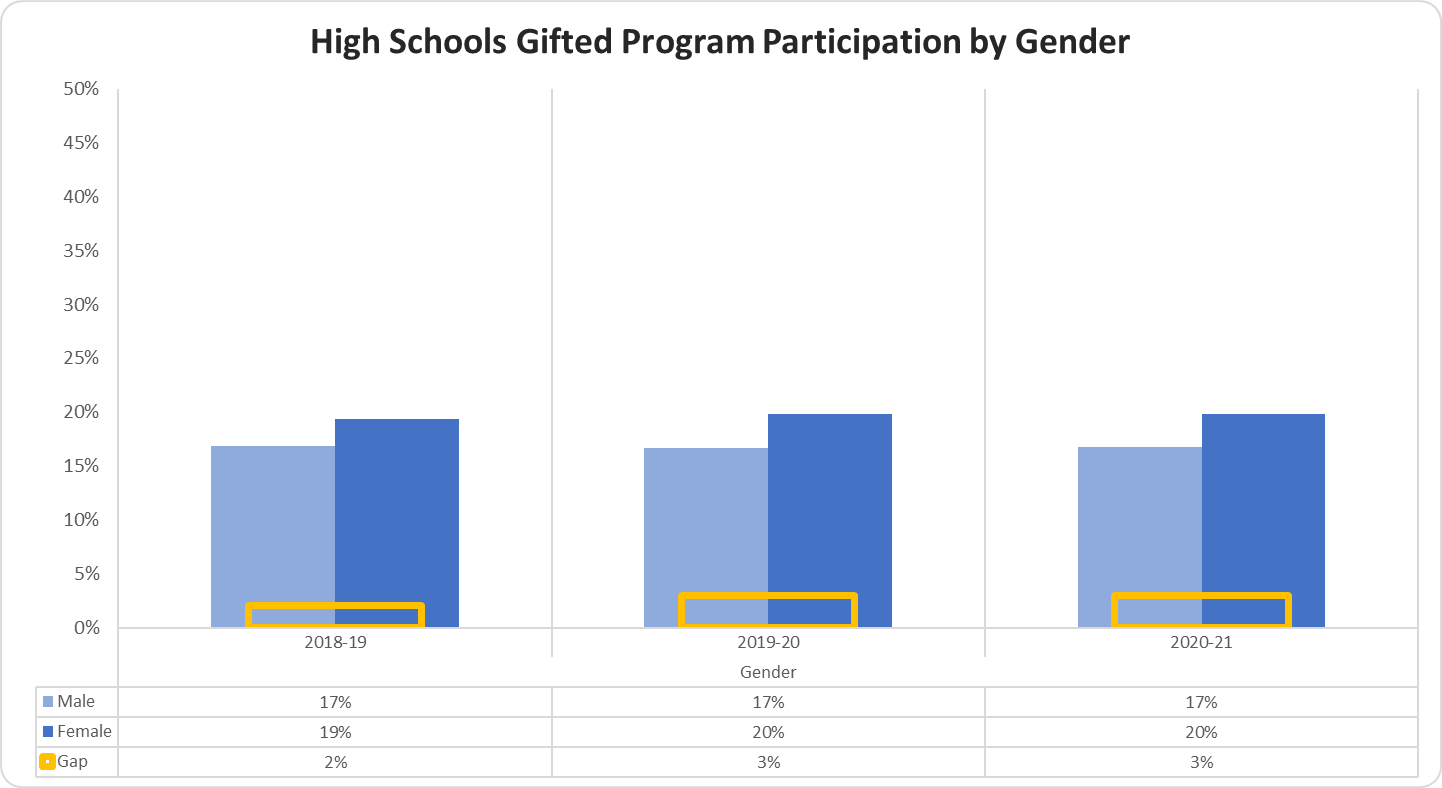
High Schools Gifted Program Participation by Gender
The High Schools Gifted Program Participation by Gender graph displays the percentage of students that participated for the most recent three years.
The percentage of Male students that participated in 2018-19 was 17%, 2019-20 was 17%, and 2020-21 was 17%; the percentage of Female students that participated in 2018-19 was 19%, 2019-20 was 20%, and 2020-21 was 20%; the gap between the two groups in 2018-19 was 2%, 2019-20 was 3%, and 2020-21 was 3%.
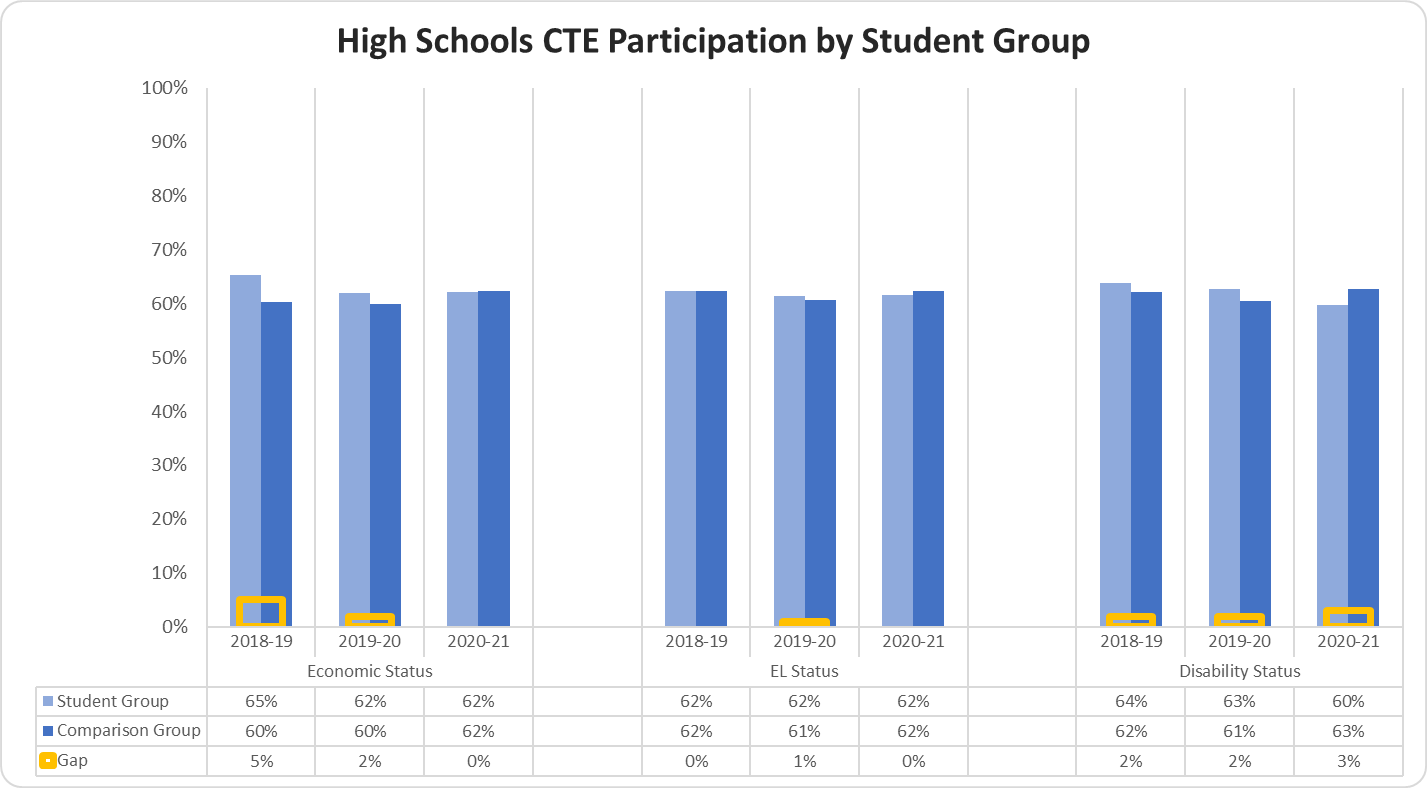
High Schools CTE Participation by Student Group
The High Schools CTE Participation by Student Group graph displays the percentage of students that participated for the most recent three years.
The percentage of Economically Disadvantaged students that participated in 2018-19 was 65%, 2019-20 was 62%, and 2019-20 was 62%; the percentage of Non-Economically Disadvantaged students that participated in 2018-19 was 60%, 2019-20 was 60%, and 2020-21 was 62%; the gap between the two groups in 2018-19 was 5%, 2019-20 was 2%, and 2020-21 was 0%.
The percentage of EL students that participated in 2018-19 was 62%, 2019-20 was 62%, and 2020-21 was 62%; the percentage of Non-EL students that participated in 2018-19 was 62%, 2019-20 was 61%, and 2020-21 was 62%; the gap between the two groups in 2018-19 was 0%, 2019-20 was 1%, and 2020-21 was 0%.
The percentage of Students with Disabilities that participated in 2018-19 was 64%, 2019-20 was 63%, and 2020-21 was 60%; the percentage of Students without Disabilities that participated in 2018-19 was 62%, 2019-20 was 61%, and 2020-21 was 63%; the gap between the two groups in 2018-19 was 2%,2019-20 was 2%, and 2020-21 was 3%.
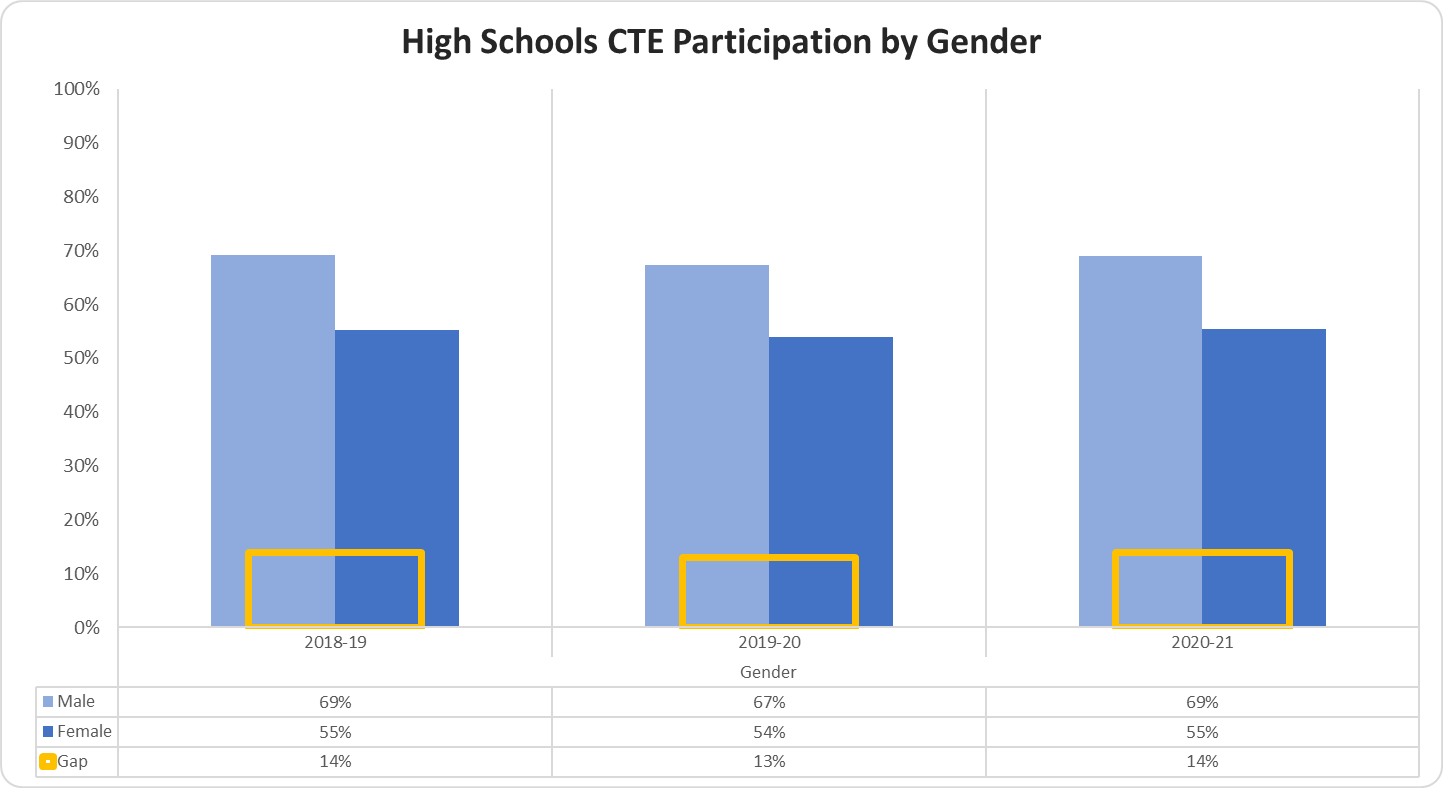
High Schools CTE Participation by Gender
The High Schools CTE Participation by Gender graph displays the percentage of students that participated for the most recent three years.
The percentage of Male students that participated in 2018-19 was 69%, 2019-20 was 67%, and 2020-21 was 69%; the percentage of Female students that participated in 2018-19 was 55%, 2019-20 was 54%, and 2020-21 was 55%; the gap between the two groups in 2018-19 was 14%, 2019-20 was 13%, and 2020-21 was 14%.
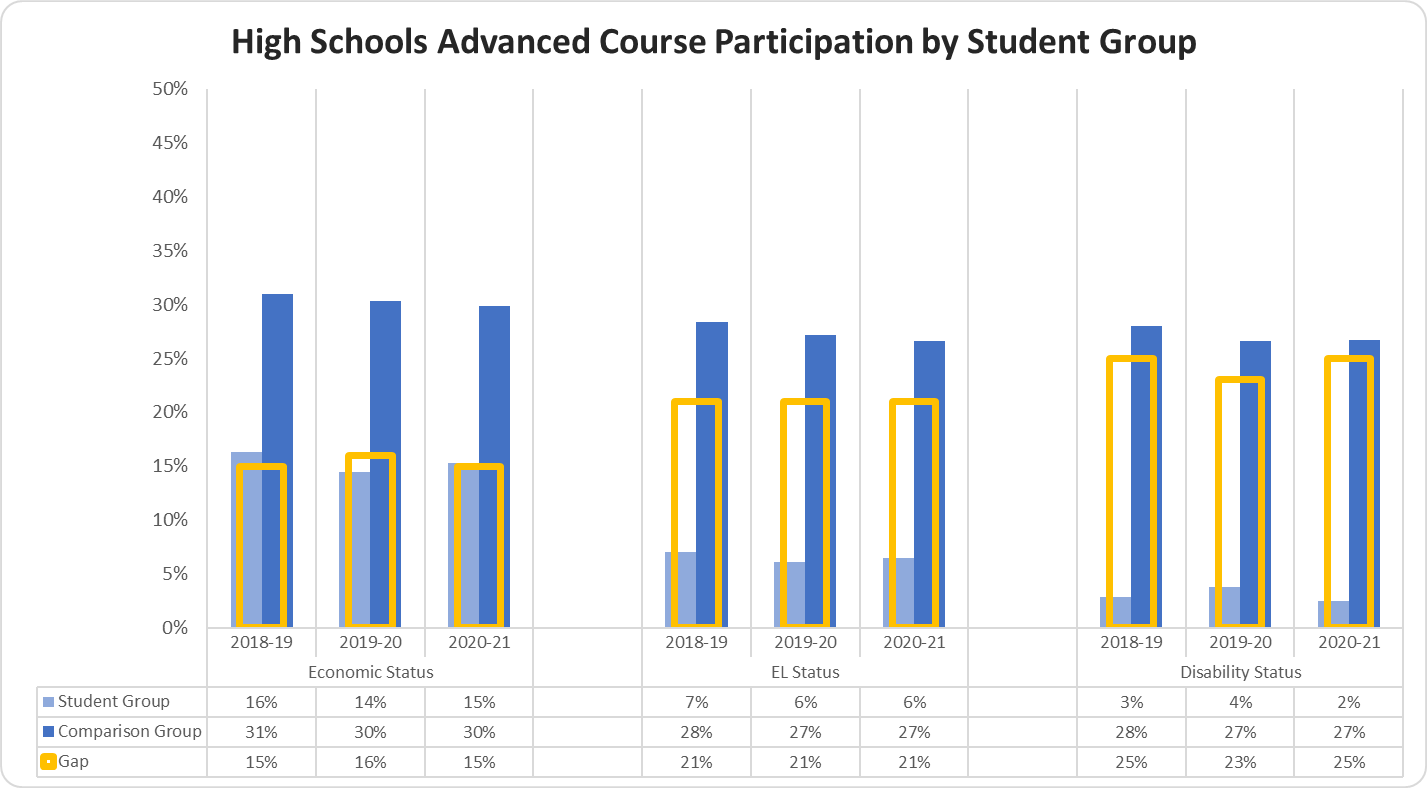
High Schools Advanced Course Participation by Student Group
The High Schools Advanced Course Participation by Student Group graph displays the percentage of students that participated for the most recent three years.
The percentage of Economically Disadvantaged students that participated in 2018-19 was 16%, 2019-20 was 14%, and 2020-21was 15%; the percentage of Non-Economically Disadvantaged students that participated in 2018-19 was 31%, 2019-20 was 30%, and 2020-21 was 30%; the gap between the two groups in 2018-19 was 15%, 2019-20 was 16%, and 2020-21 was 15%.
The percentage of EL students that participated in 2018-19 was 7%, 2019-20 was 6%, and 2020-21 was 6%; the percentage of Non-EL students that participated in 2018-19 was 28%, 2019-20 was 27%, and 2020-21 was 27%; the gap between the two groups in 2018-19 was 21%, 2019-20 was 21%, and 2020-21 was 21%.
The percentage of Students with Disabilities that participated in 2018-19 was 3%, 2019-20 was 4%, and 2020-21 was 2%; the percentage of Students without Disabilities that participated in 2018-19 was 28%, 2019-20 was 27%, and 2020-21 was 27%; the gap between the two groups in 2018-19 was 25%, 2019-20 was 23%, and 2020-21 was 25%.
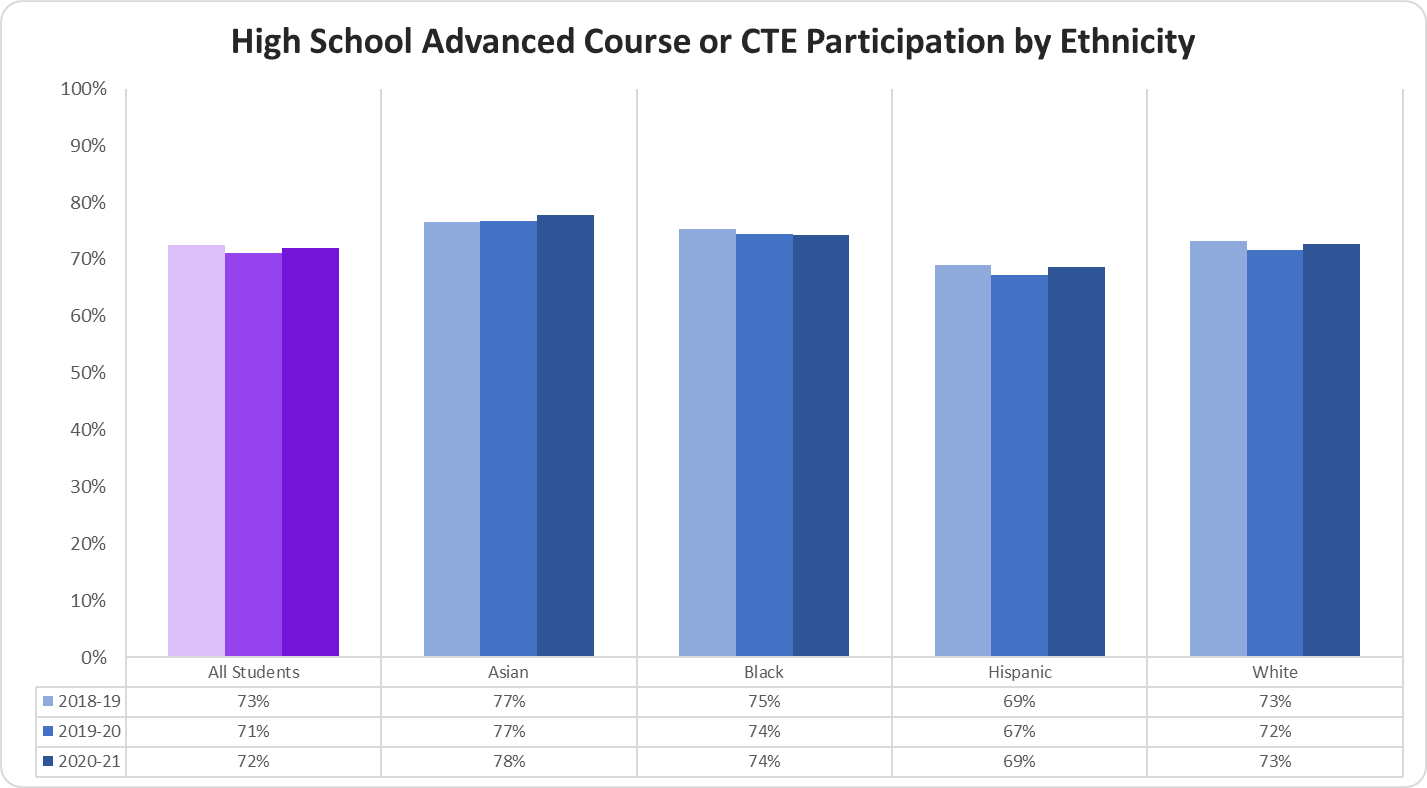
High Schools Advanced Course Participation by Gender
The High Schools Advanced Course Participation by Gender graph displays the percentage of students that participated for the most recent three years.
The percentage of Male students that participated in 2018-19 was 21%, 2019-20 was 20%, and 2020-21 was 20%; the percentage of Female students that participated in 2018-19 was 30%, 2019-20 was 28%, and 2020-21 was 28%; the gap between the two groups in 2018-19 was 9%, 2019-20 was 8%, and 2020-21 was 8%.
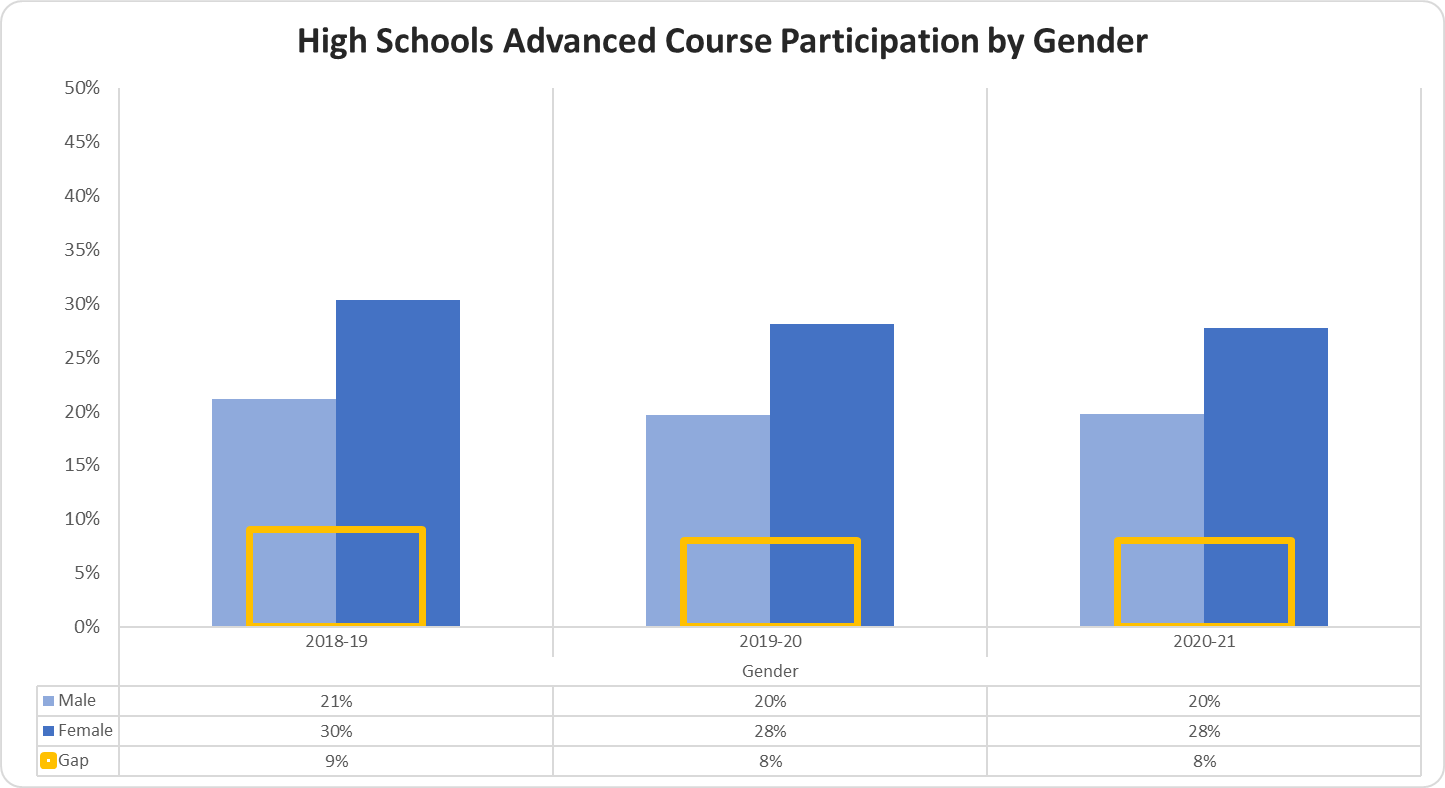
High Schools Dual Enrollment Participation by Student Group
The High Schools Dual Enrollment Course Participation by Student Group graph displays the percentage of students that participated for the most recent three years.
The percentage of Economically Disadvantaged students that participated in 2018-19 was 4%, 2019-20 was 4%, and 2020-21 was 4%; the percentage of Non-Economically Disadvantaged students that participated in 2018-19 was 8%, 2019-20 was 8%, and 2020-21 was 9%; the gap between the two groups in 2018-19 was 4%, 2019-20 was 4%, and 2020-21 was 5%.
The percentage of EL students that participated in 2018-19 was 1%, 2019-20 was 1%, and 2020-21 was 1%; the percentage of Non-EL students that participated in 2018-19 was 7%, 2019-20 was 7%, and 2020-21 was 8%; the gap between the two groups in 2018-19 was 6%, 2019-20 was 6%, and 2020-21 was 7%.
The percentage of Students with Disabilities that participated in 2018-19 was 1%, 2019-20 was 1%, and 2020-21 was 1%; the percentage of Students without Disabilities that participated in 2018-19 was 7%, 2019-20 was 7%, and 2020-21 was 8%; the gap between the two groups in 2018-19 was 6%, 2019-20 was 6%, and 2020-21 was 7%.
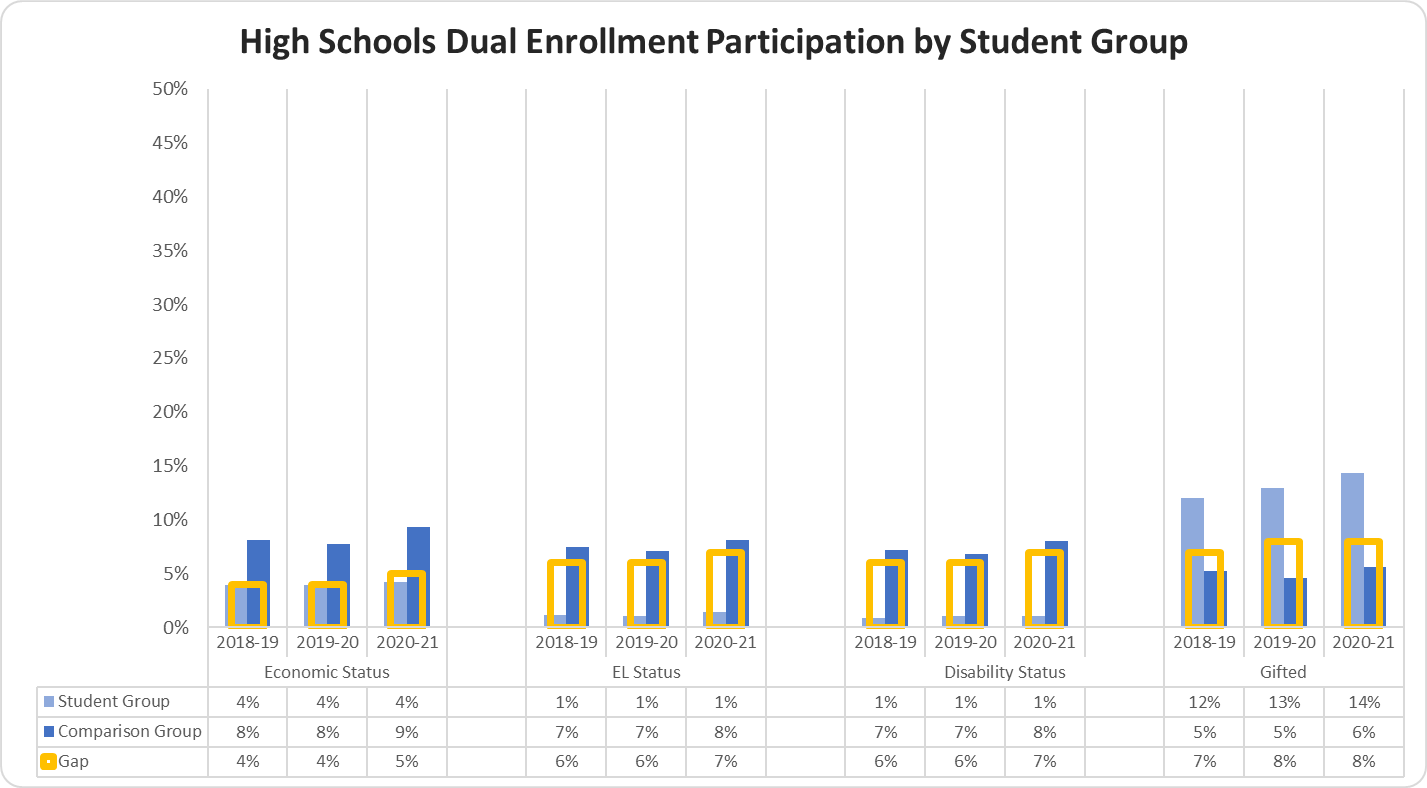
High Schools Dual Enrollment Participation by Gender
The High Schools Dual Enrollment Course Participation by Gender graph displays the percentage of students that participated for the most recent three years.
The percentage of male students that participated in 2018-19 was 6%, in 2019-20 was 5%, and in 2020-21 was 6%; the percentage of female students that participated in 2018-19 was 7%, in 2019-20 was 7%, and in 2020-21 was 8%; the gap between the two groups in 2018-19 was 1%, in 2019-20 was 2%, and in 2020-21 was 2%.
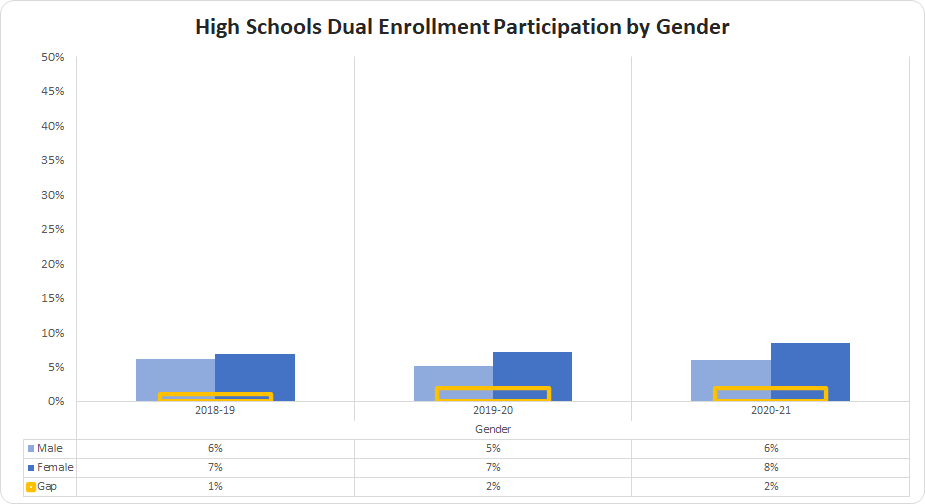
High School Advanced Course or CTE Participation by Ethnicity
The High Schools Advanced Course or CTE Participation by Ethnicity graph displays the percentage by ethnicity of who participated in either CTE or Advanced coursework for the most recent three years.
The percentage of All Students that participated in 2018-19 was 73%, 2019-20 was 71%, and 2020-21 was 72%; the percentage of Asian students that participated in 2018-19 was 77%, 2019-20 was 77%, and 2020-21 was 78%; the percentage of Black students that participated in 2018-19 was 75%, 2019-20 was 74%, and 2020-21 was 74%; the percentage of Hispanic students that participated in 2018-19 was 69%, 2019-20 was 67%, and 2020-21 was 69%; the percentage of White students that participated in 2018-19 was 73%, 2019-20 was 72%, and 2020-21 was 73%.
High School Advanced Course or CTE Participation by Student Group
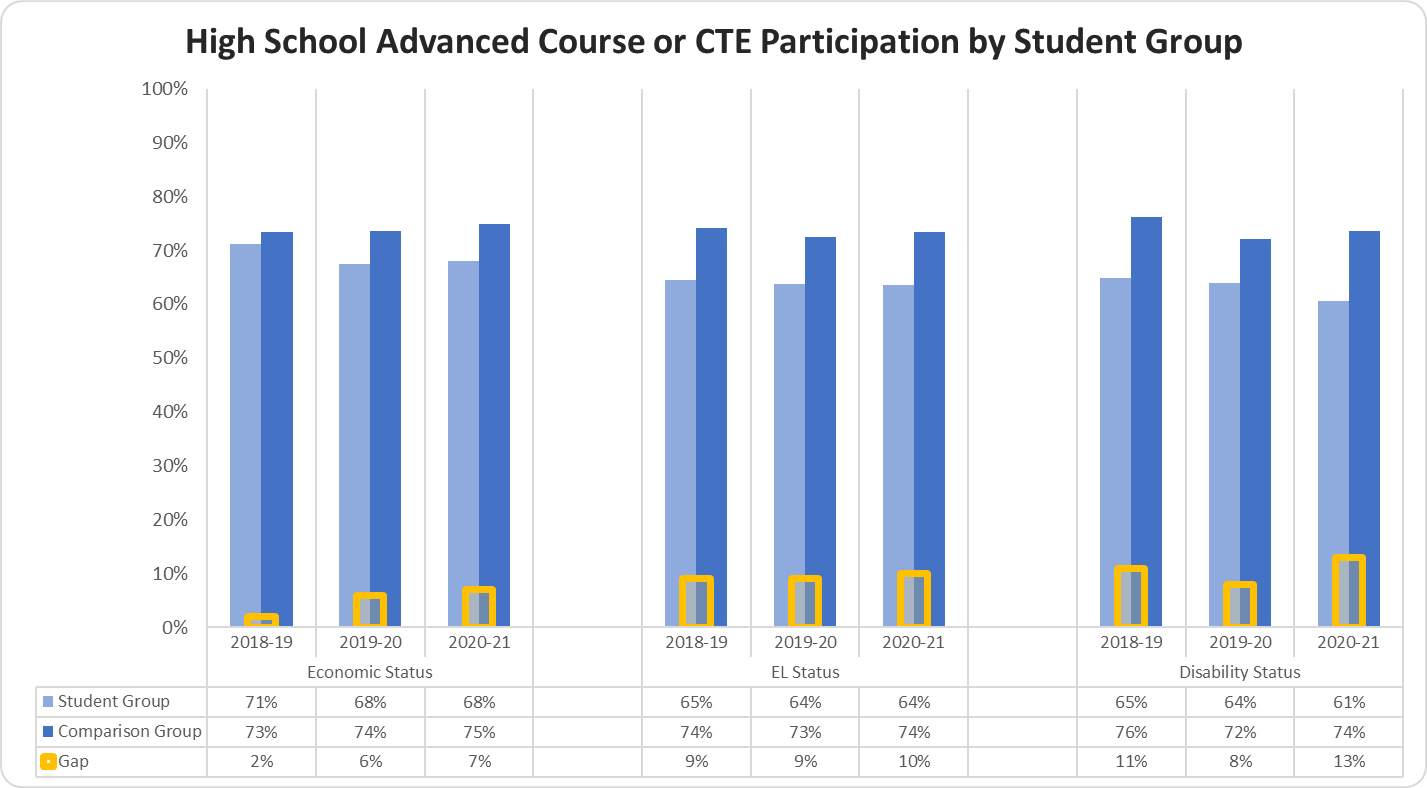
The High Schools Advanced Course or CTE Participation by Student Group graph displays the percentage by student group of who participated in either CTE or Advanced coursework for the most recent three years.
The percentage of Economically Disadvantaged students that participated in 2018-19 was 71%, 2019-20 was 68%, and 2020-21 was 68%; the percentage of Non-Economically Disadvantaged students that participated in 2018-19 was 73%, 2019-20 was 74%, and 2020-21 was 75%; the gap between the two groups in 2018-19 was 2%, 2019-20 was 6%, and 2020-21 was 7%.
The percentage of EL students that participated in 2018-19 was 65%, 2019-20 was 64%, and 2020-21 was 64%; the percentage of Non-EL students that participated in 2018-19 was 74%, 2019-20 was 73%, and 2020-21 was 74%; the gap between the two groups in 2018-19 was 9%, 2019-20 was 9%, and 2020-21 was 10%.
The percentage of Students with Disabilities that participated in 2018-19 was 65%, 2019-20 was 64%, and 2020-21 was 61%; the percentage of Students without Disabilities that participated in 2018-19 was 76%, 2019-20 was 72%, and 2020-21 was 74%; the gap between the two groups in 2018-19 was 11%, 2019-20 was 8%, and 2020-21 was 13%.
Special Education
Percent of Students Identified for Special Education by Ethnicity
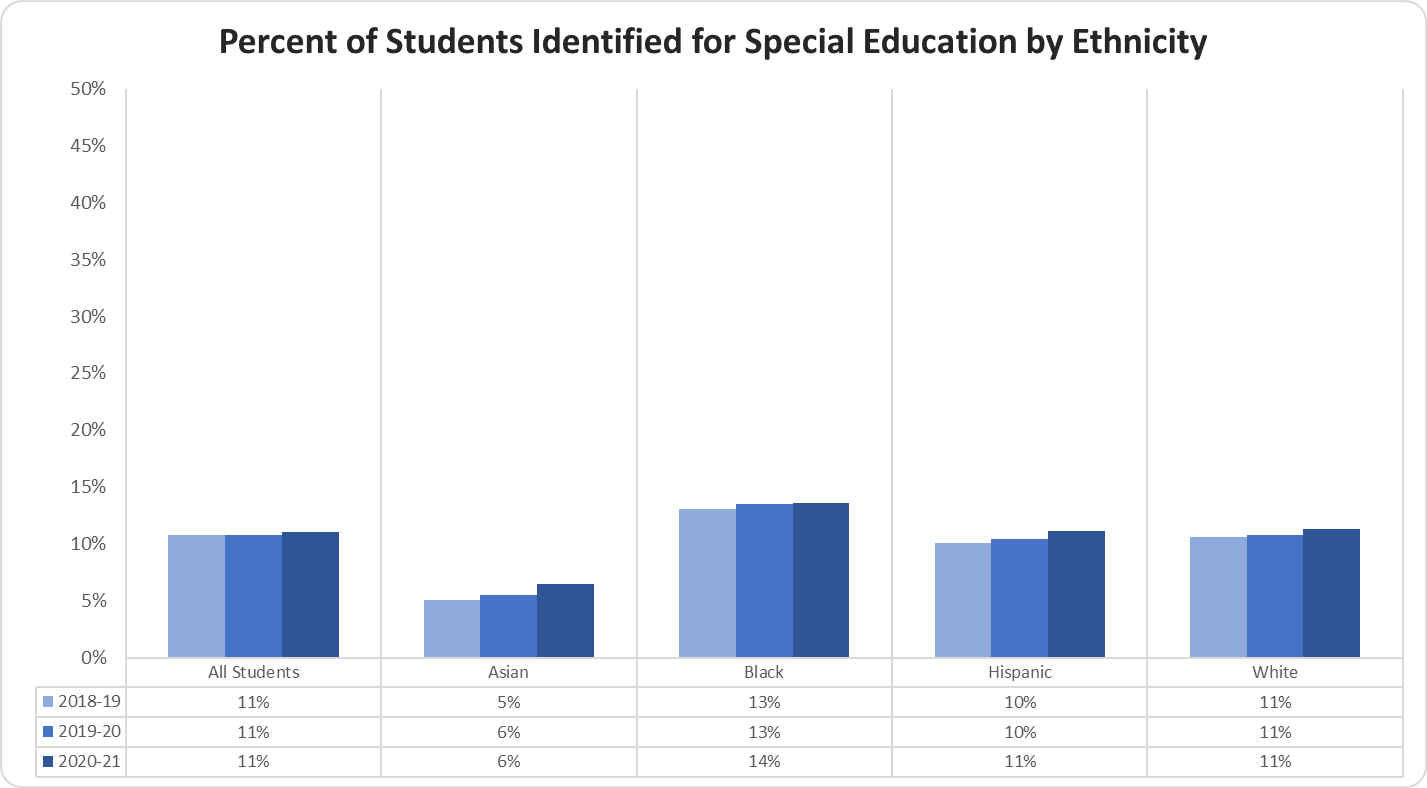
The Percent of Students Identified for Special Education by Ethnicity graph displays the percentage of students that were identified as special education students for the most recent three years.
The percentage of All Students identified for Special Education in 2018-19 was 11%, 2019-20 was 11%, and 2020-21 was 11%; the percentage of Asian students identified for Special Education in 2018-19 was 5%, 2019-20 was 6%, and 2020-21 was 6%; the percentage of Black students identified for Special Education in 2018-19 was 13%, 2019-20 was 13%, and 2020-21 was 14%; the percentage of Hispanic students identified for Special Education in 2018-19 was 10%, 2019-20 was 10%, and 2020-21 was 11%; the percentage of White students identified for Special Education in 2018-19 was 11%, 2019-20 was 11%, and 2020-21 was 11%.
Percent of Students Identified for Special Education by Student Group
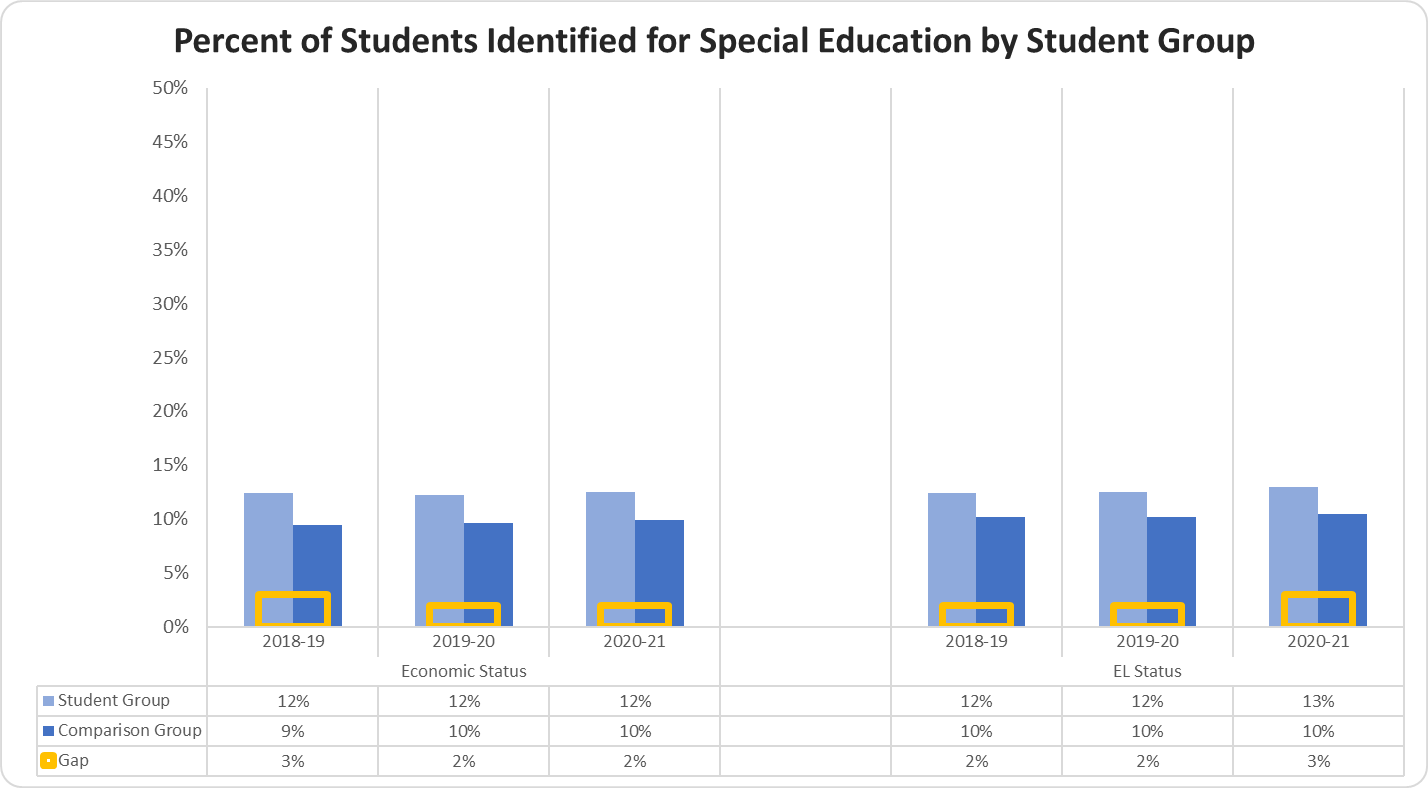
The Percent of Students Identified for Special Education by Student Group graph displays the percentage of students that were identified as special education students for the most recent three years.
The percentage of Economically Disadvantaged students that identified for Special Education in 2018-19 was 12%, 2019-20 was 12%, and 2020-21 was 12%; the Non-Economically Disadvantaged students that identified for Special Education in 2018-19 was 9%, 2019-20 was 10%, and 2020-21 was 10%; the gap between the two groups in 2018-19 was 3%, 2019-20 was 2%, and 2020-21 was 2%.
The percentage of EL students that identified for Special Education in 2018-19 was 12%, 2019-20 was 12%, and 2020-21 was 13%; the Non-EL students that identified for Special Education in 2018-19 was 10%, 2019-20 was 10%, and 2020-21 was 10%; the gap between the two groups in 2018-19 was 2%, 2019-20 was 2%, and 2020-21 was 3%.
Percent of Students Identified for Special Education by Gender
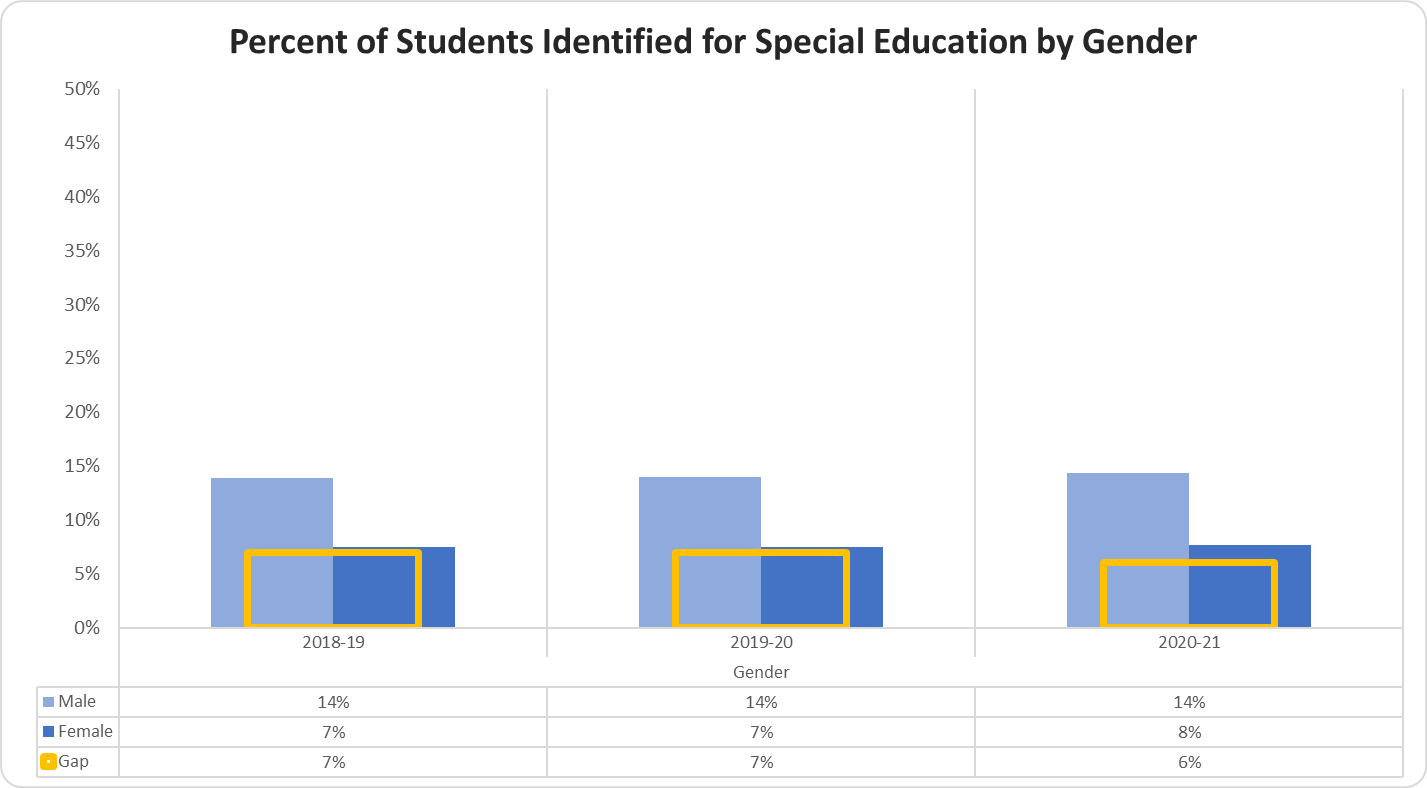
The Percent of Students Identified for Special Education by Gender graph displays the percentage of students that were identified as special education students for the most recent three years.
The percentage of Male students that identified for Special Education in 2018-19 was 14%, 2019-20 was 14%, and 2020-21 was 14%; the Female students that identified for Special Education in 2018-19 was 7%, 2019-20 was 7%, and 2020-21 was 8%; the gap between the two groups in 2018-19 was 7%, 2019-20 was 7%, and 2020-21 was 6%.
